dv01 — Data Analytics Platform
Year
2024
Client
dv01
Category
Web App Design
Tags
dv01 is a structured finance data analytics platform trusted by institutional investors, asset managers, and broker-dealers to analyze loan-level data across securitization deals. As Senior Data Visualization Designer II, I have been embedded across multiple product teams since 2019 — owning end-to-end design of core analytical features and driving UX innovation across the platform.
Role & Responsibilities
Working closely with product managers, engineers, and quantitative analysts, I translated highly complex financial datasets into intuitive, actionable interfaces. My responsibilities spanned interaction design, data visualization strategy, component library development, and cross-functional design leadership.
Deal Surveillance & Overview
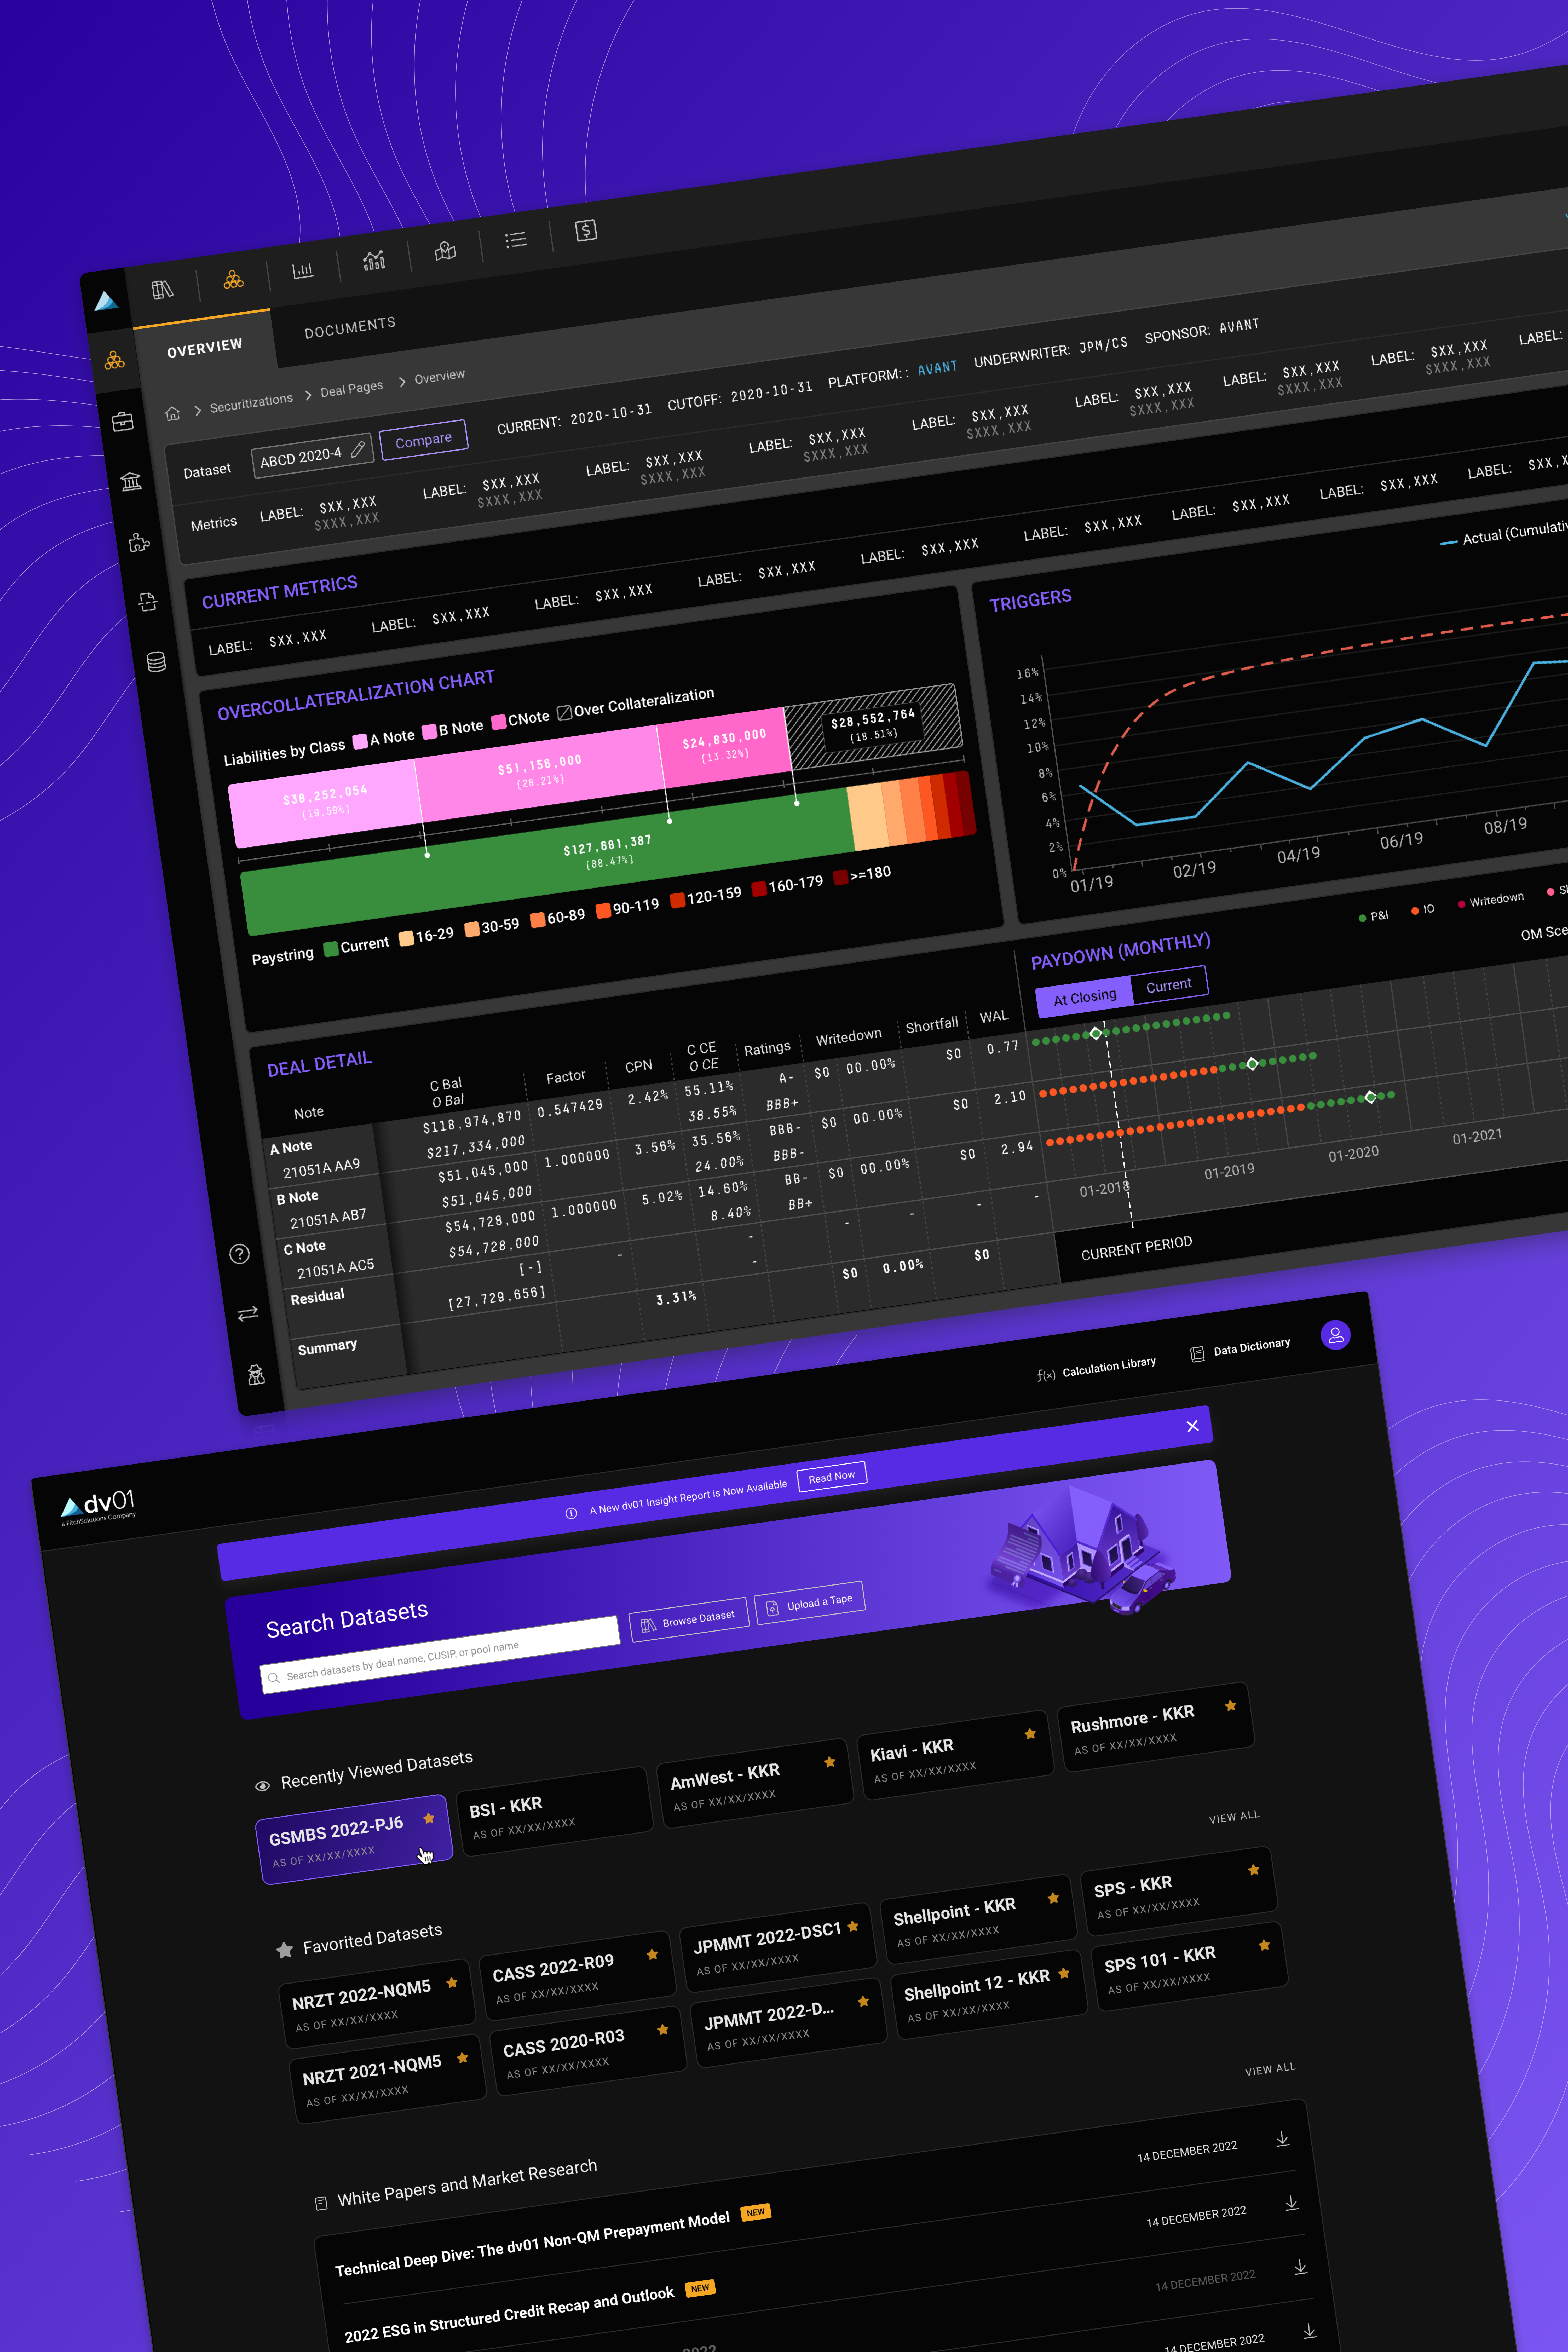
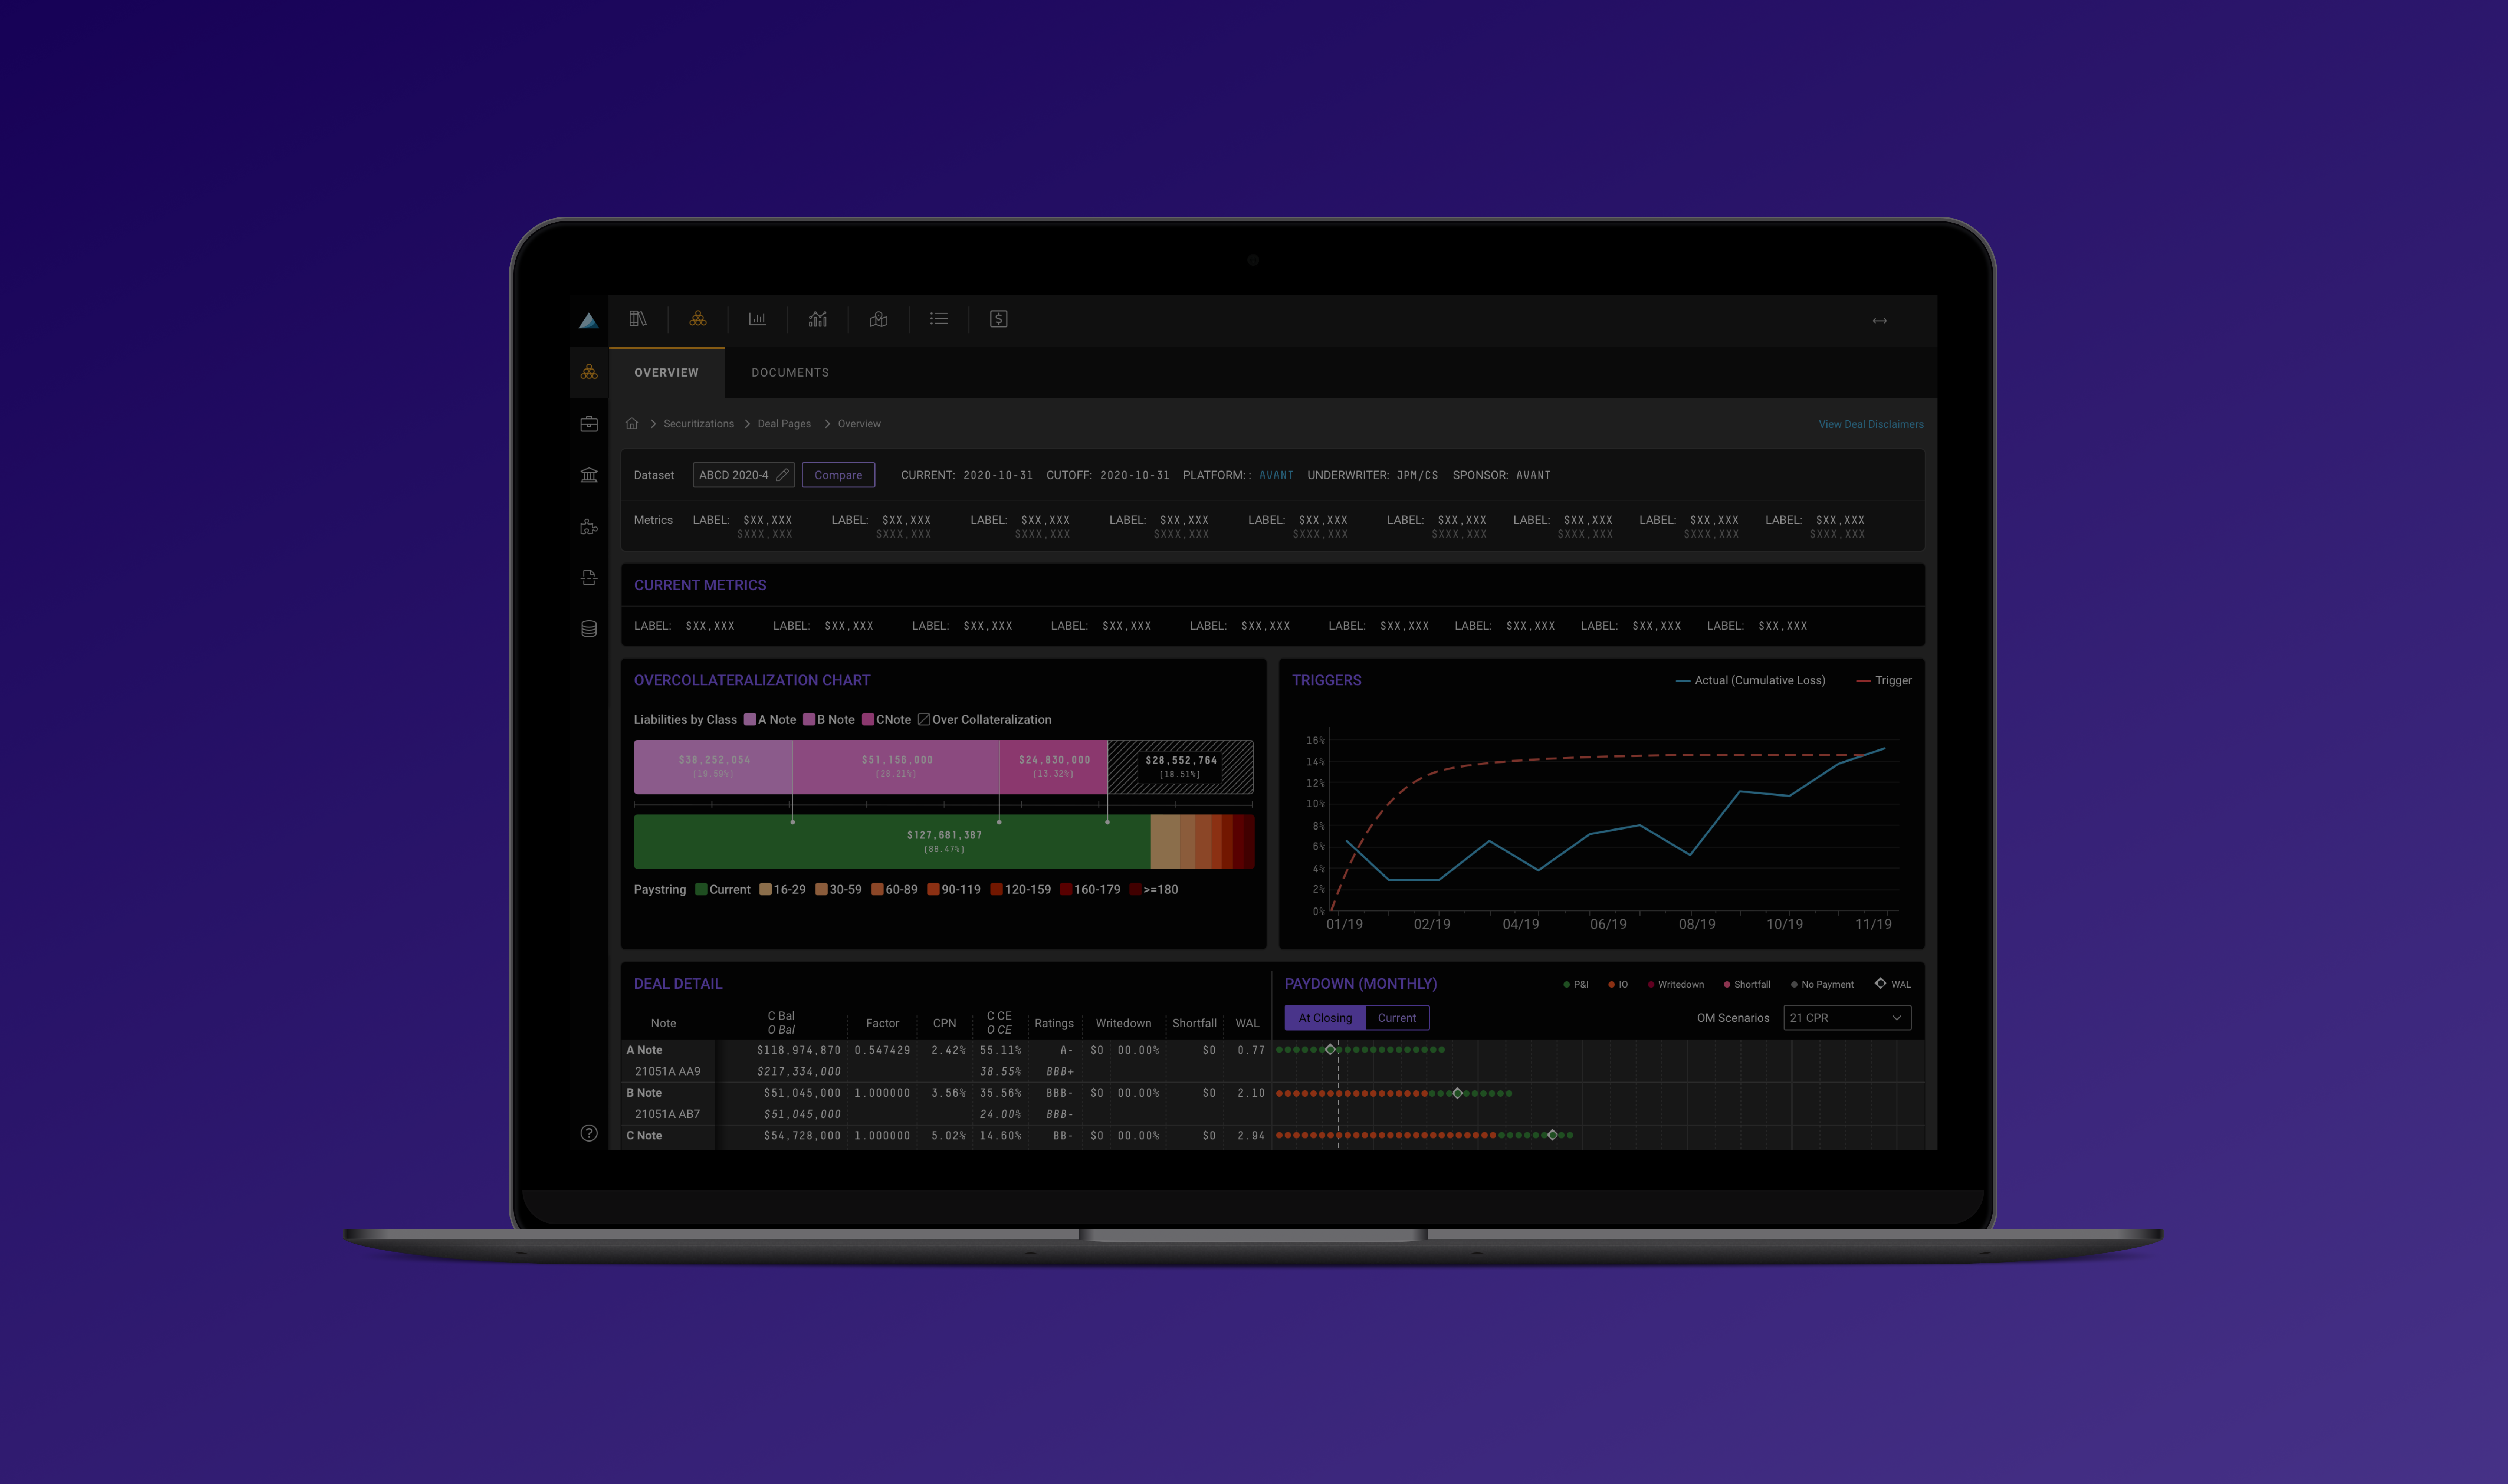
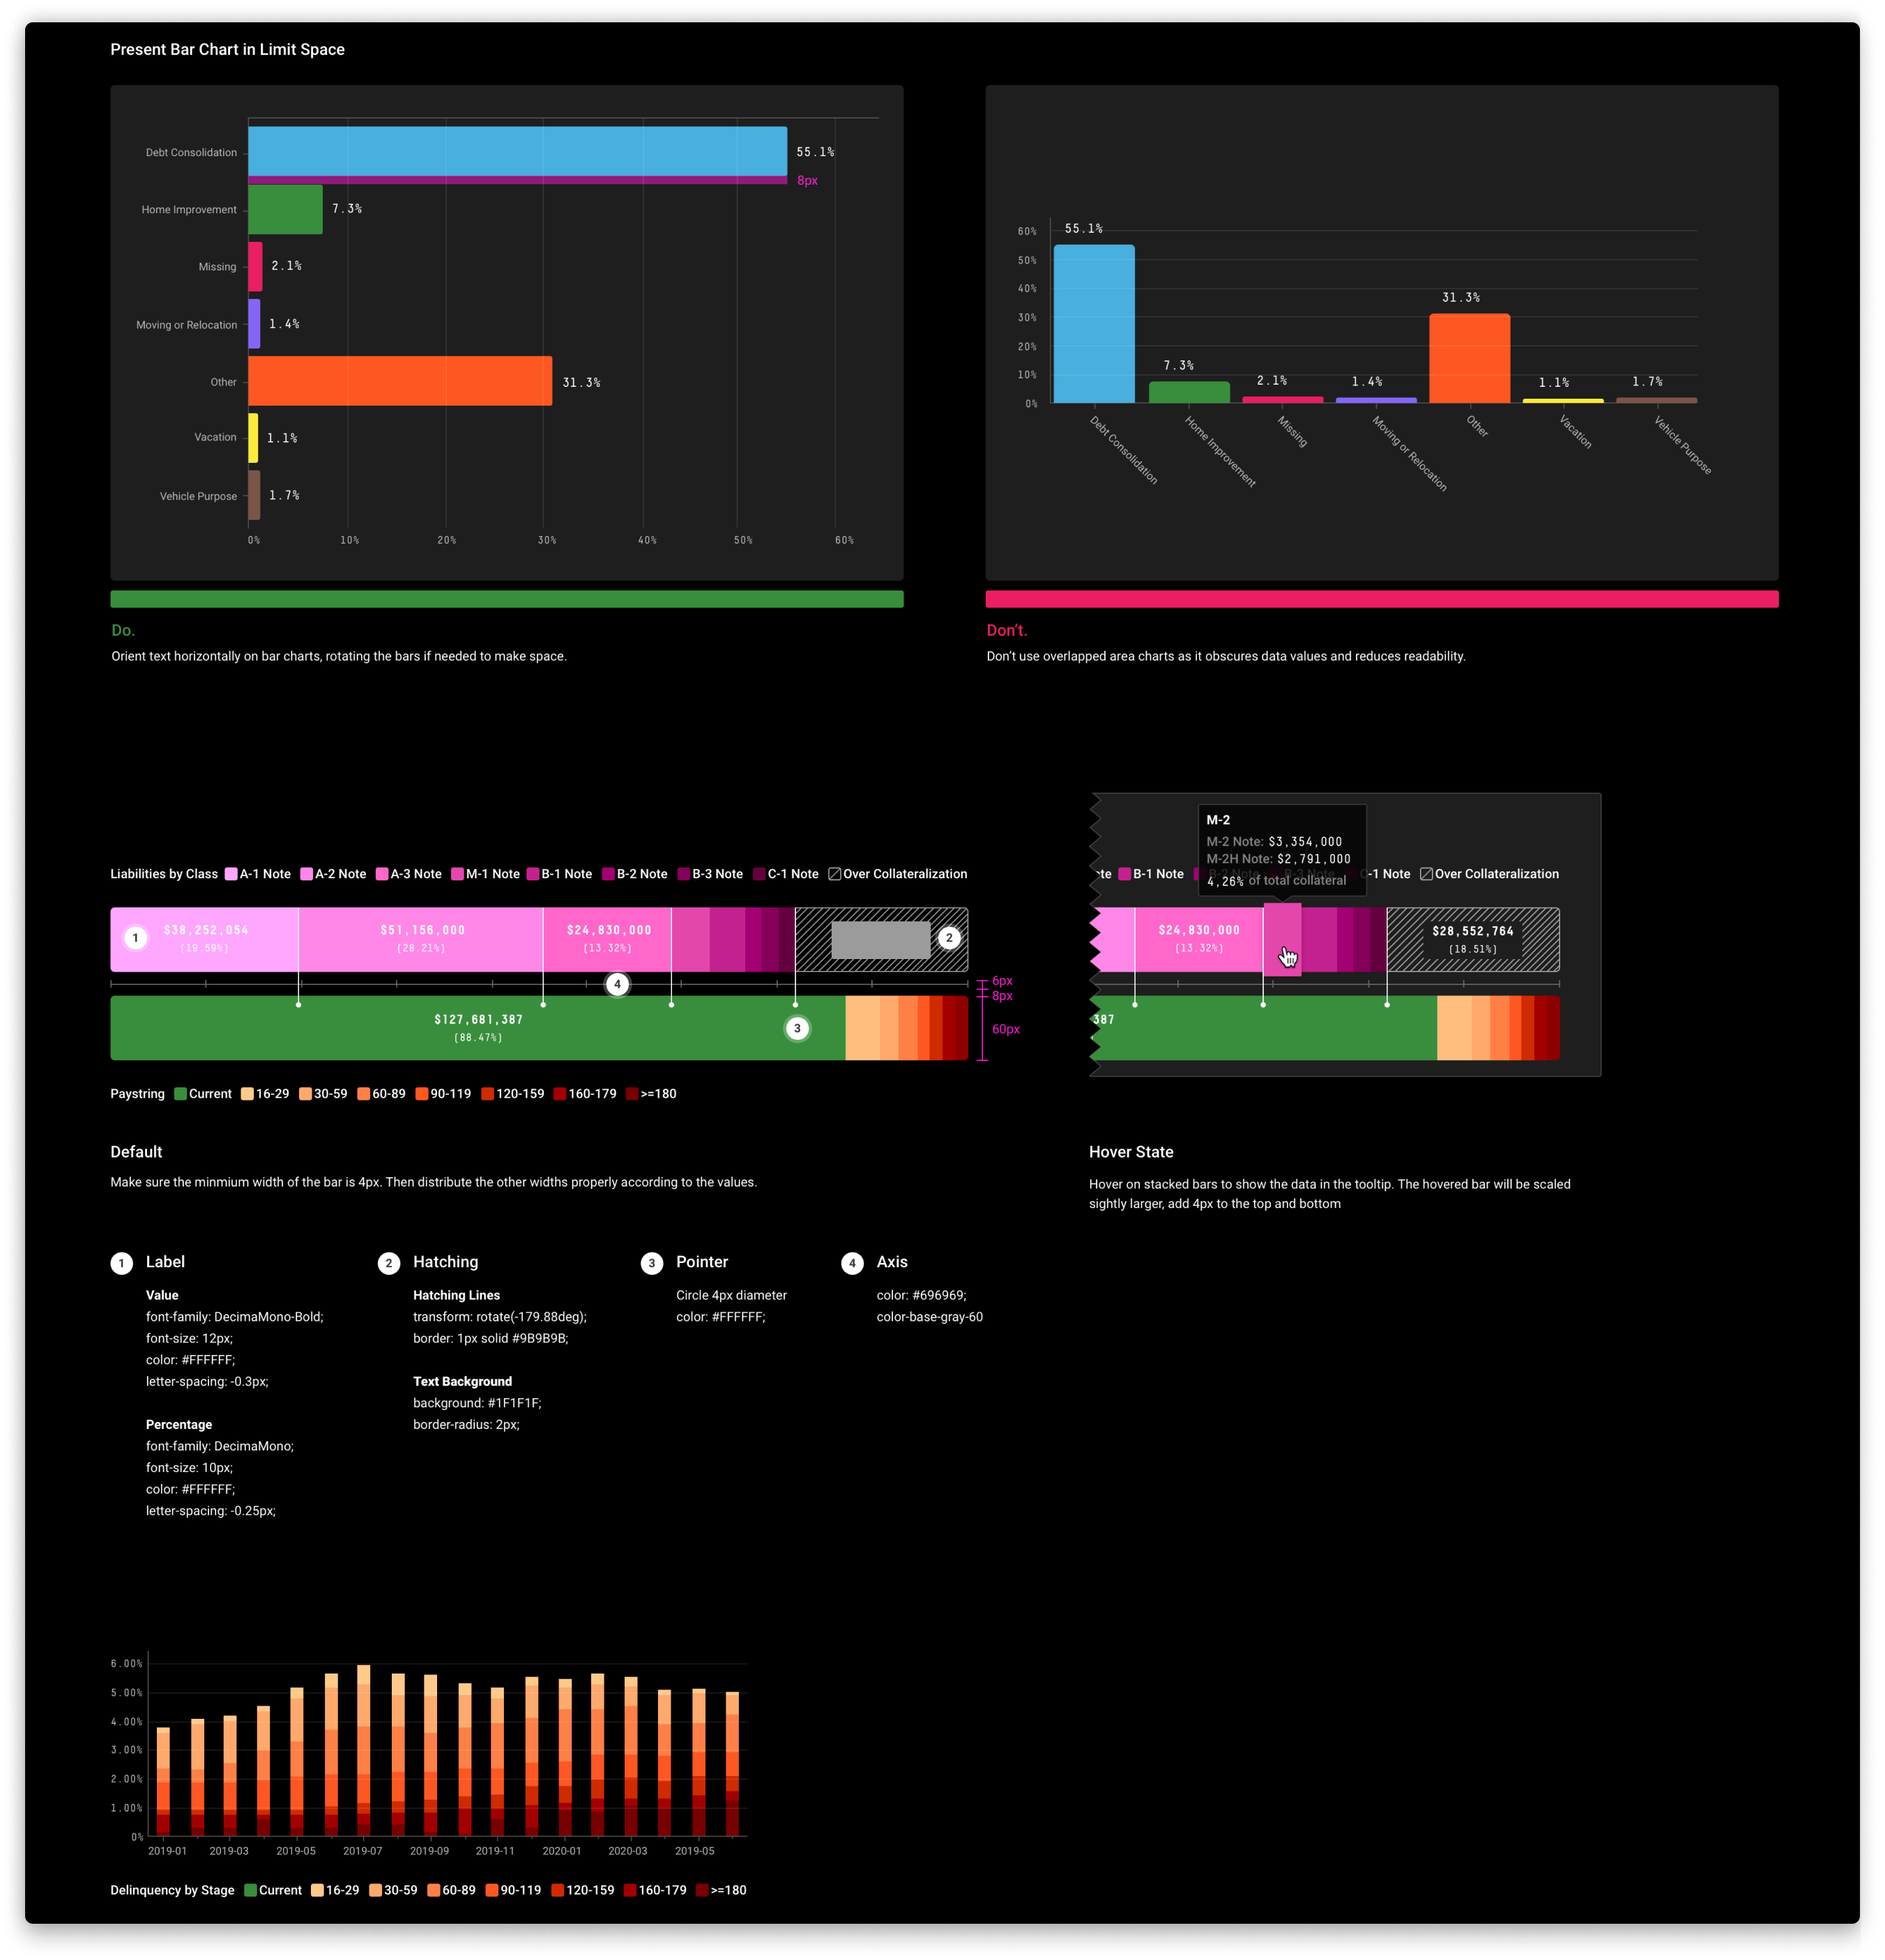
Redesigned the deal overview experience to give investors an immediate, at-a-glance understanding of deal health. Key features include an overcollateralization chart with layered liability classes, a paydown timeline with scenario modeling, and a deal detail table consolidating note-level metrics — all within a unified dark-theme interface optimized for extended analytical sessions.
Portfolio Analysis & Performance
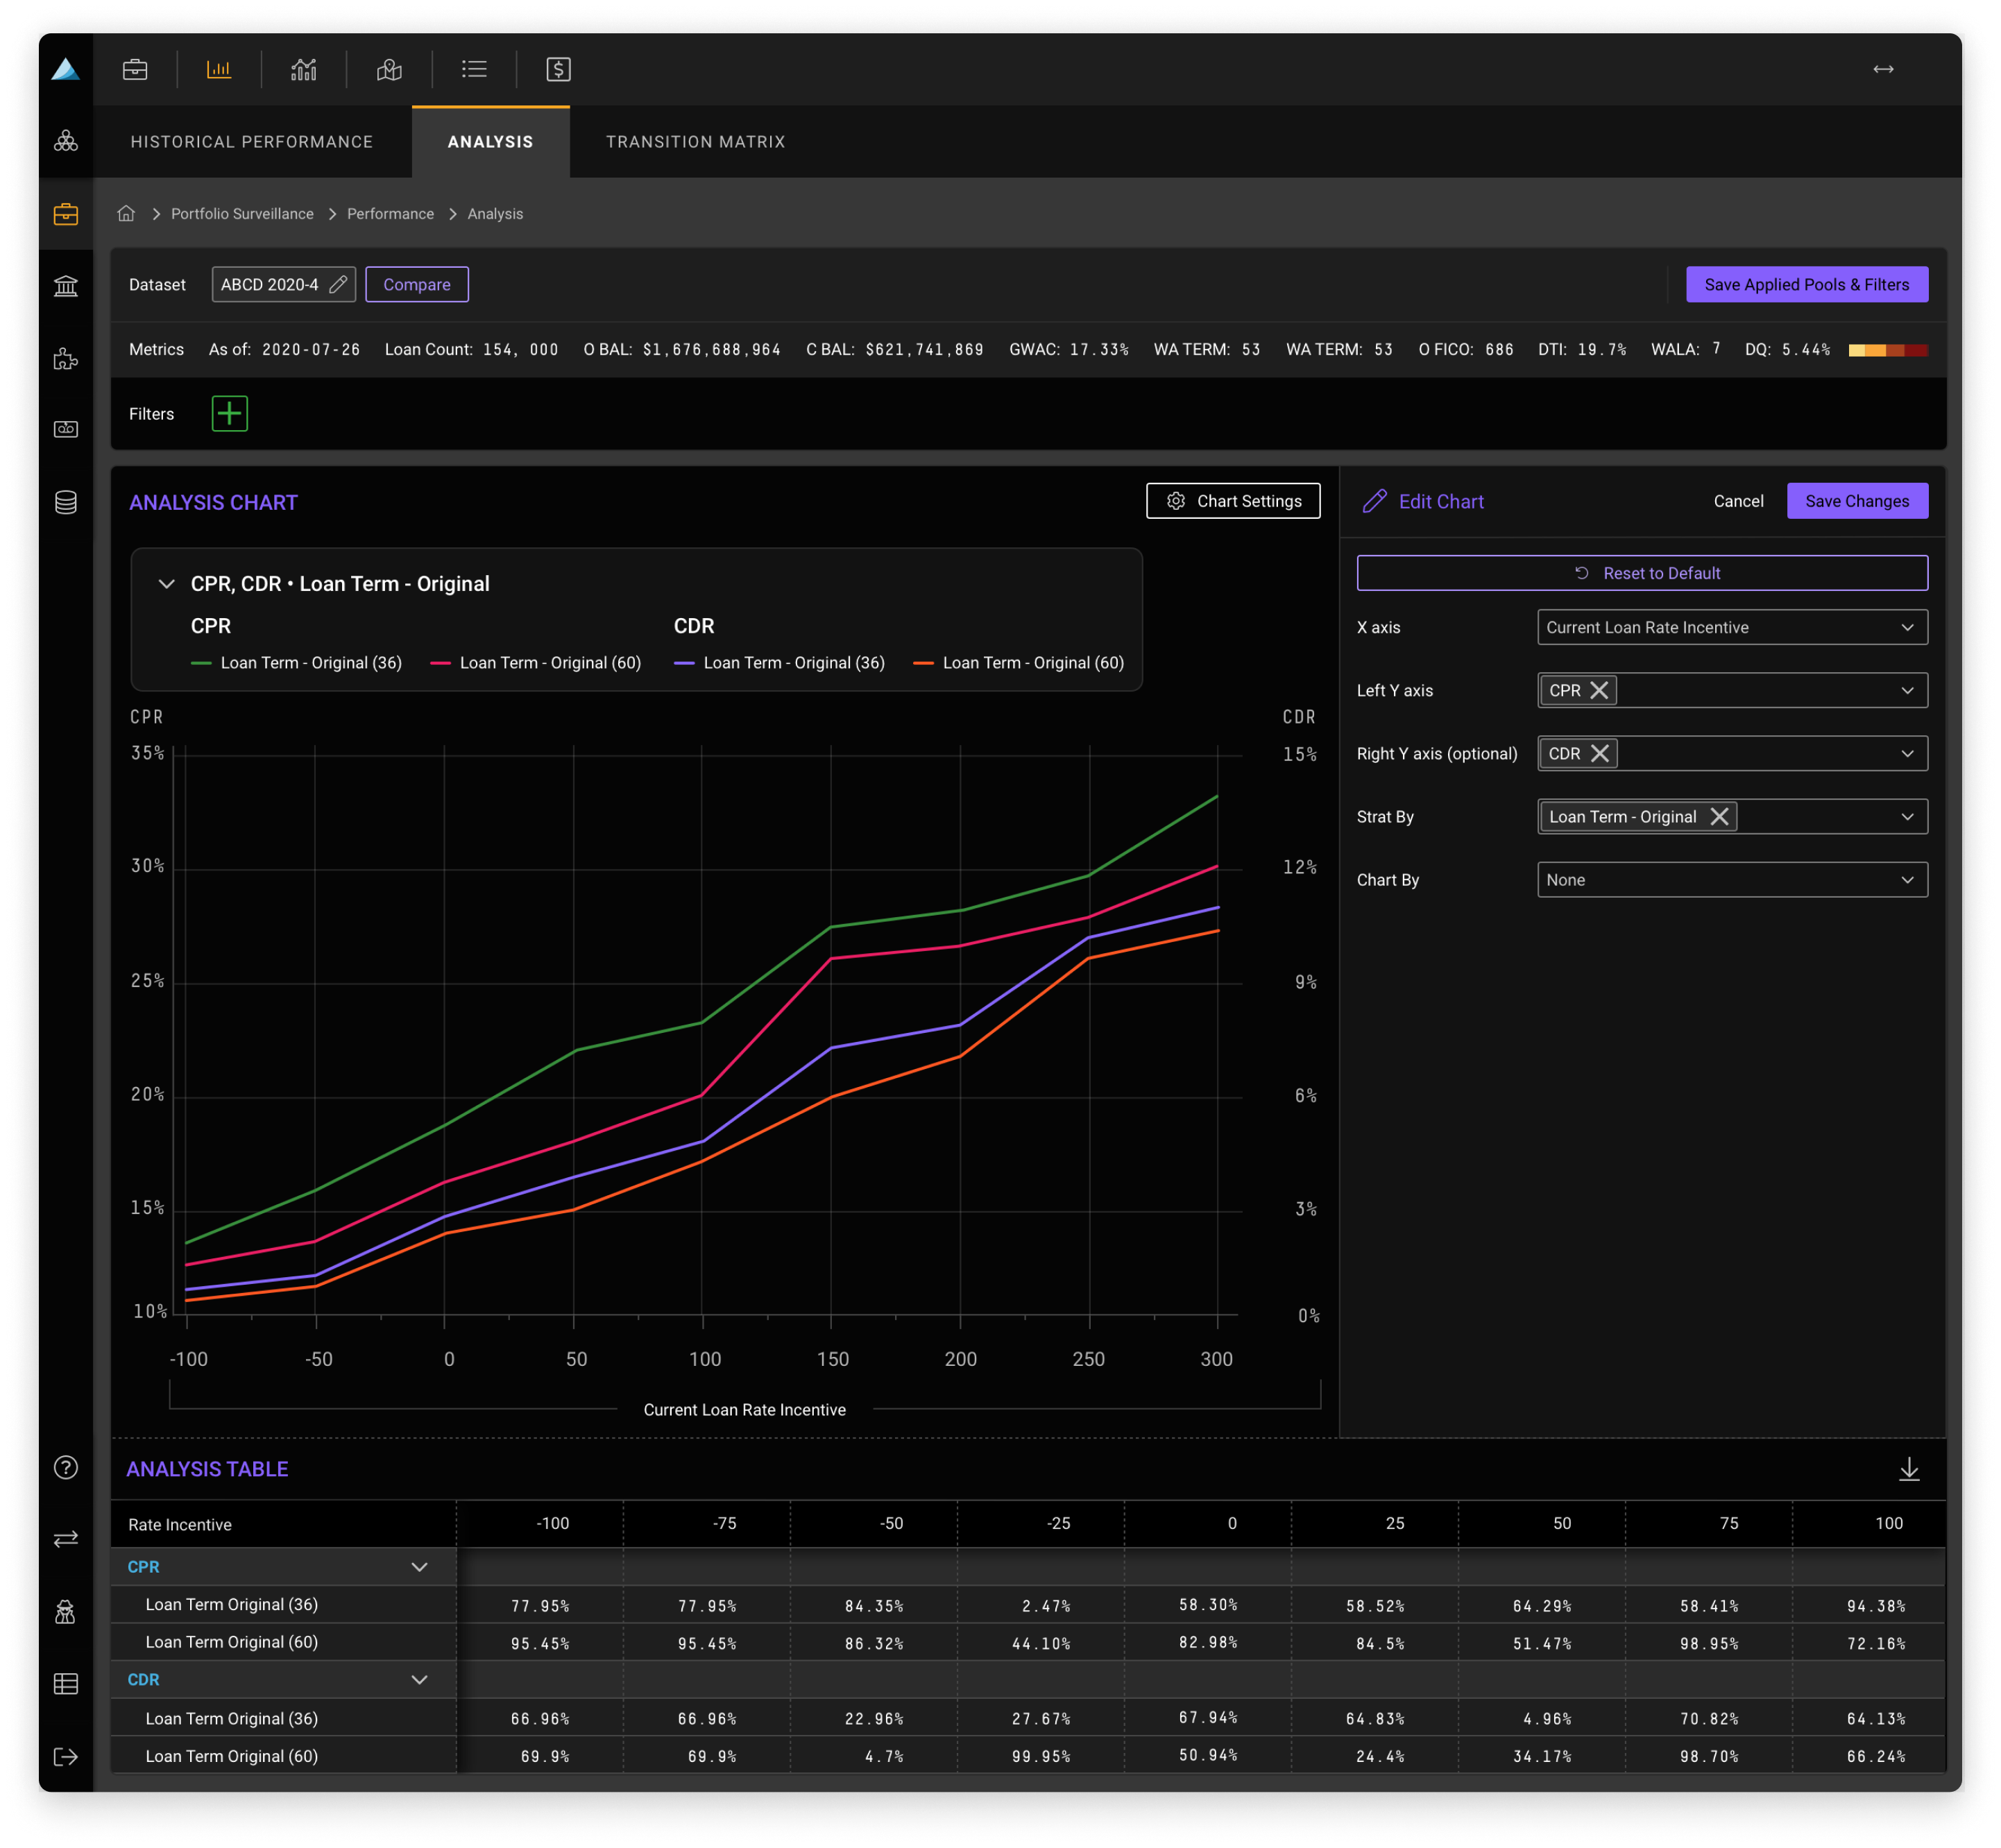
Designed an interactive analysis chart system allowing users to configure multi-axis visualizations — combining CPR, CDR, and other loan performance metrics stratified by attributes such as loan term, FICO score, and rate incentive. The configurable chart builder empowers analysts to explore correlations without requiring engineering support.
Geographic Distribution
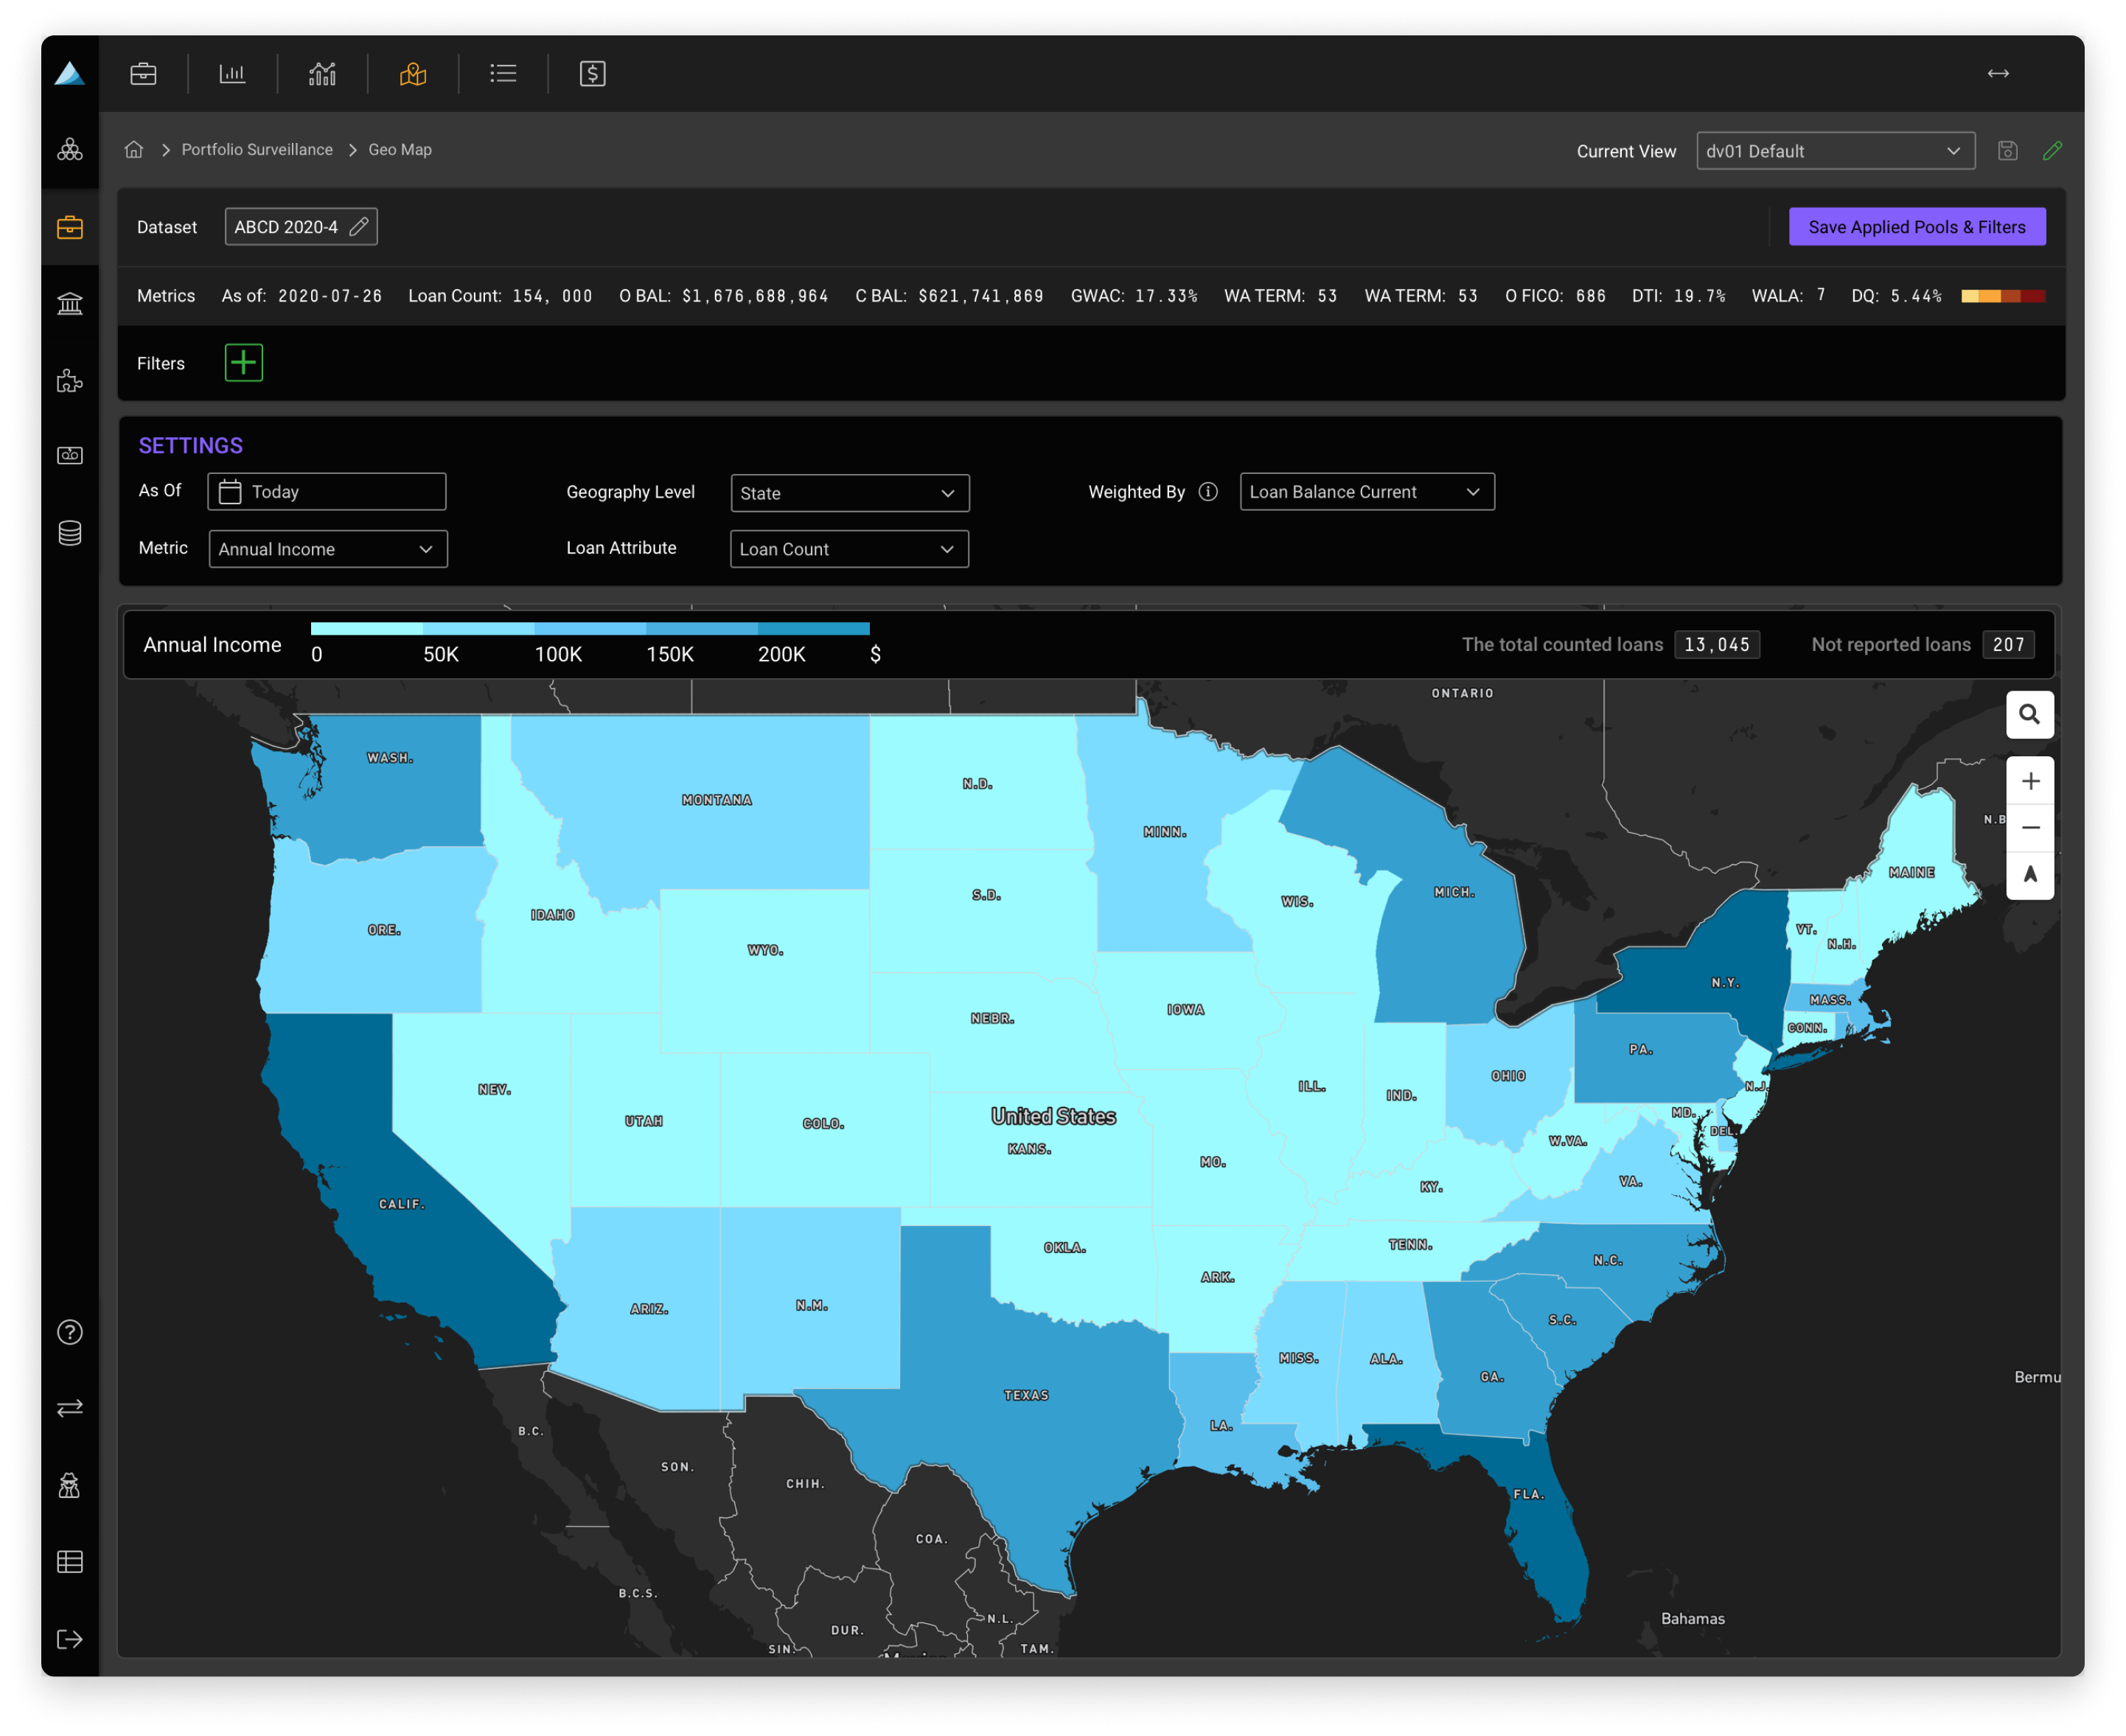
Built a geo-mapping module enabling users to visualize loan portfolio concentration across U.S. states, weighted by balance, income, or custom attributes. The choropleth map integrates seamlessly with the platform's global filter system, updating in real time as users refine their dataset.
Transition Matrix
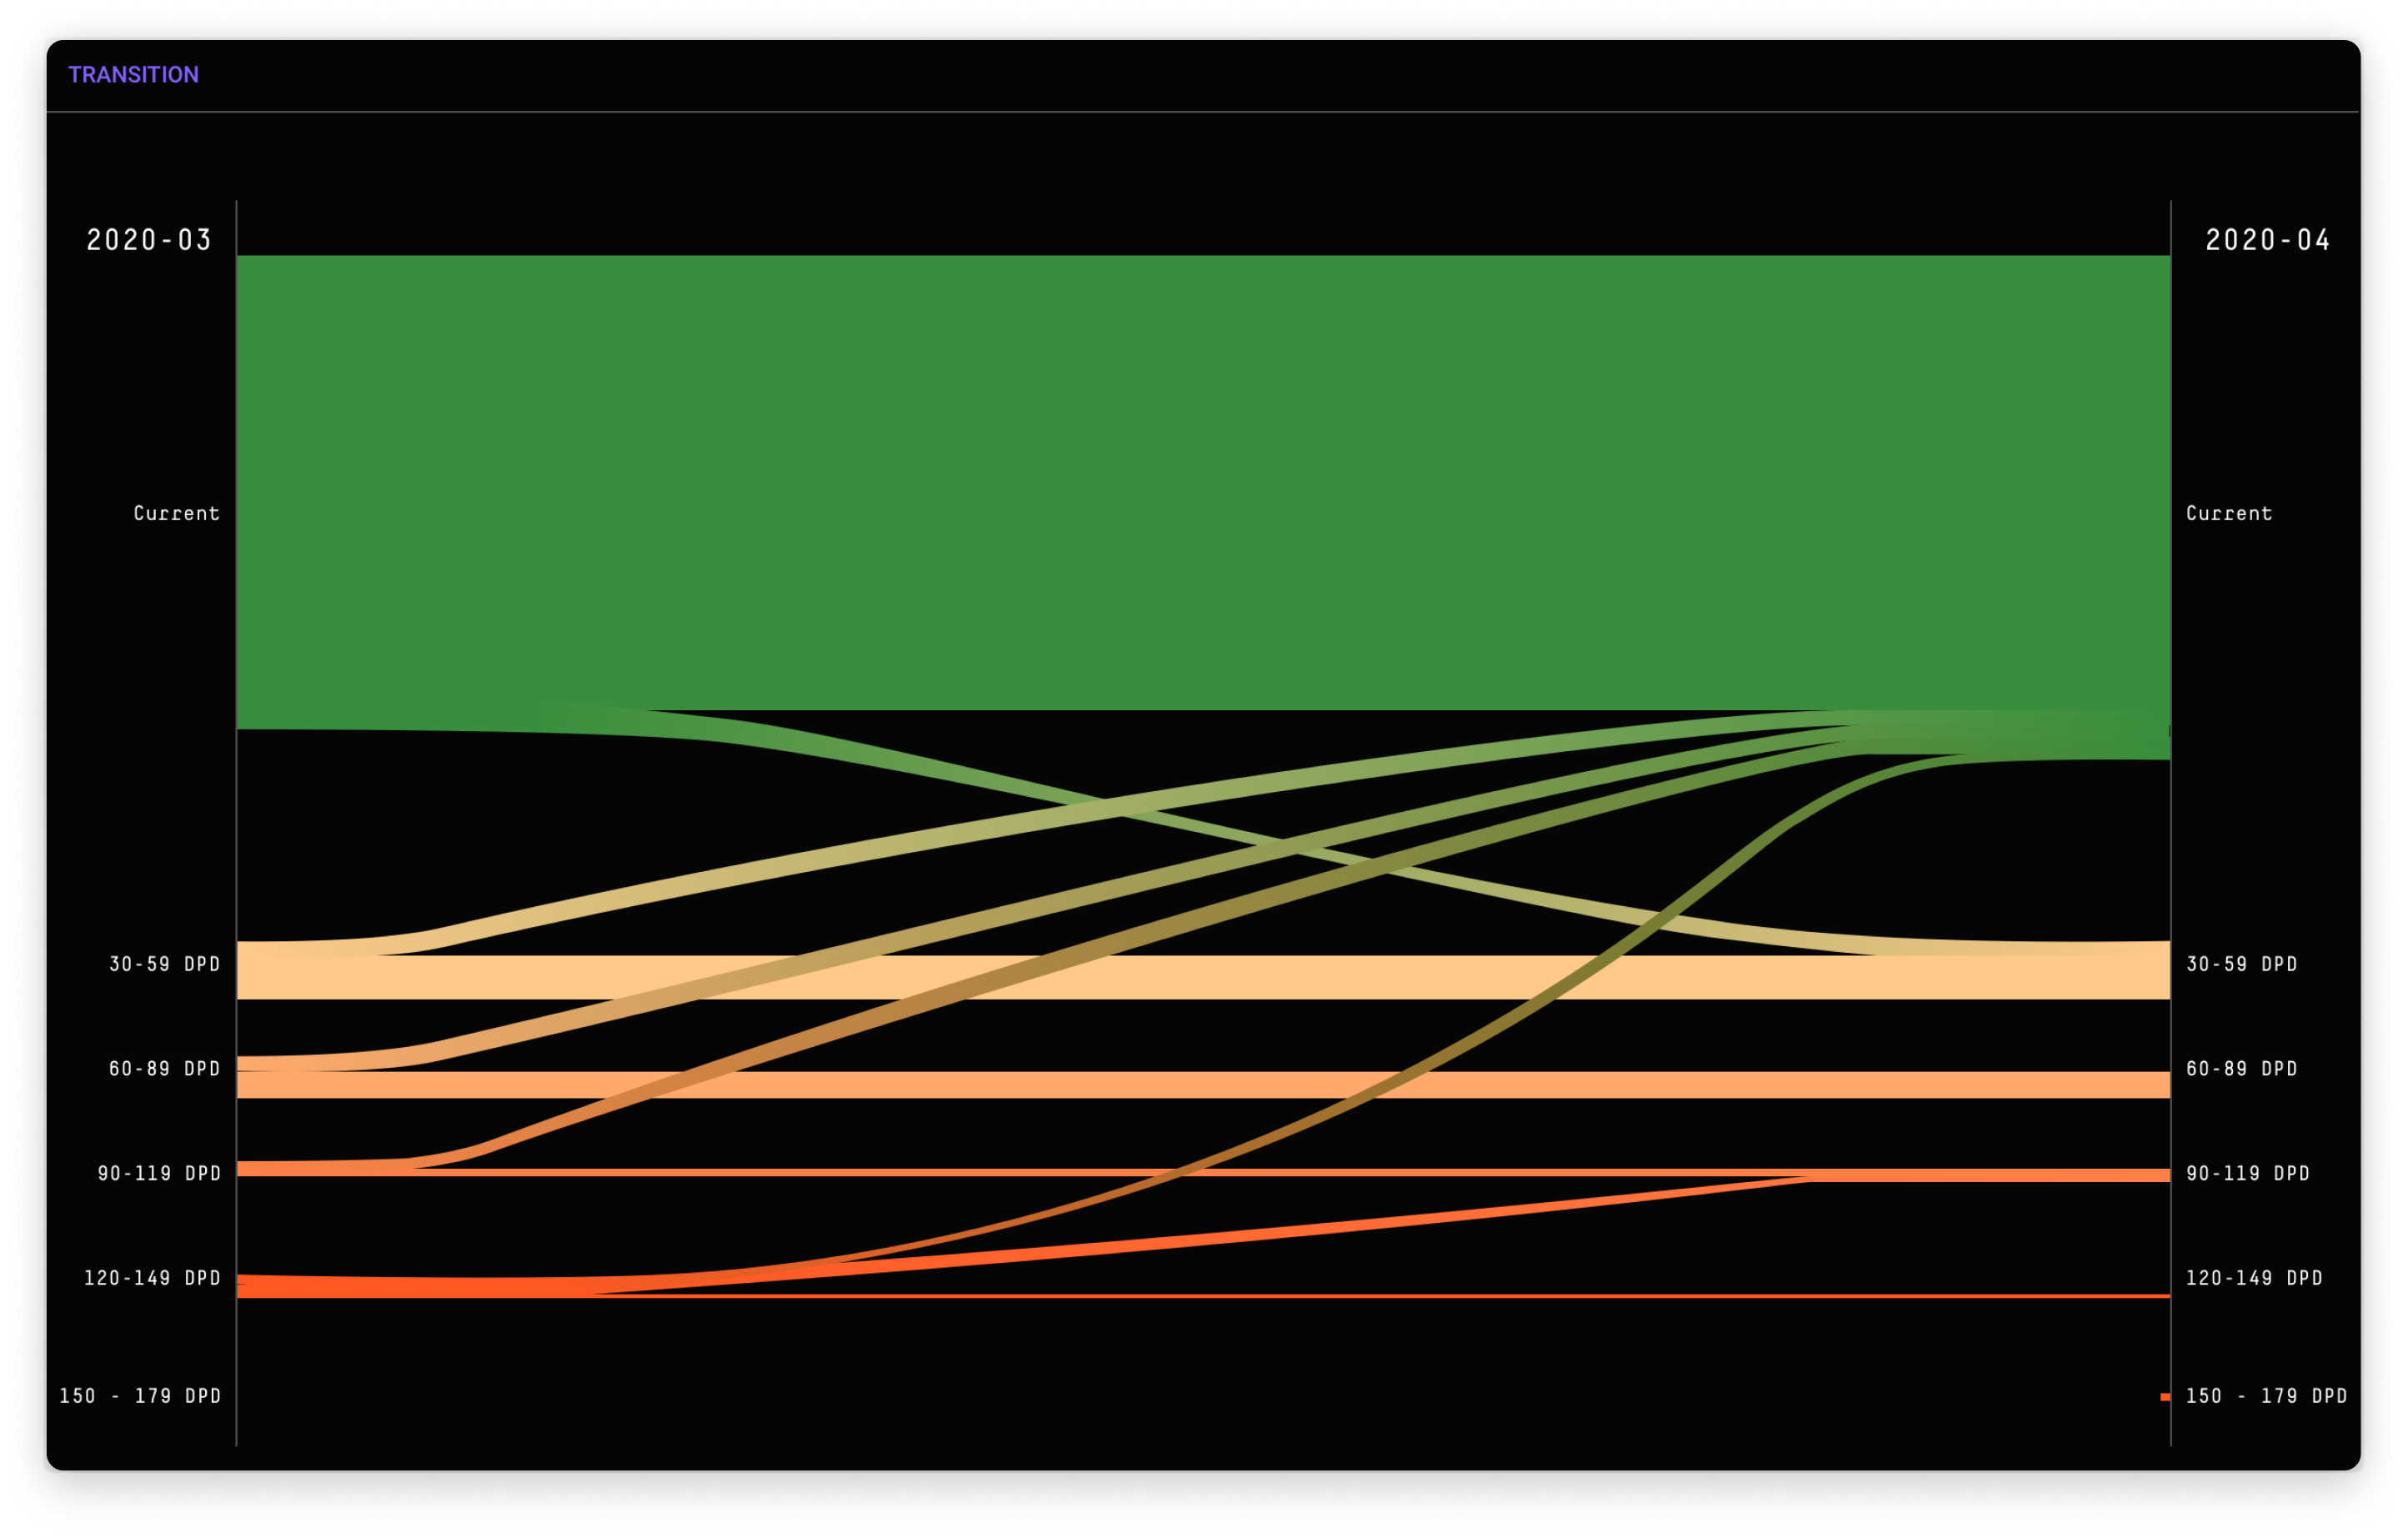
Designed a Sankey-based transition matrix that visualizes how loans migrate between delinquency stages month over month — turning a traditionally tabular report into an instantly readable flow diagram that reveals patterns invisible in raw data.
Pool Comparison
Developed a side-by-side pool comparison experience that allows investors to evaluate two securitization deals across dozens of metrics simultaneously — including FICO distribution, LTV, delinquency rates, and coupon analysis — through a cohesive set of stacked bar charts, dot plots, and summary scorecards.
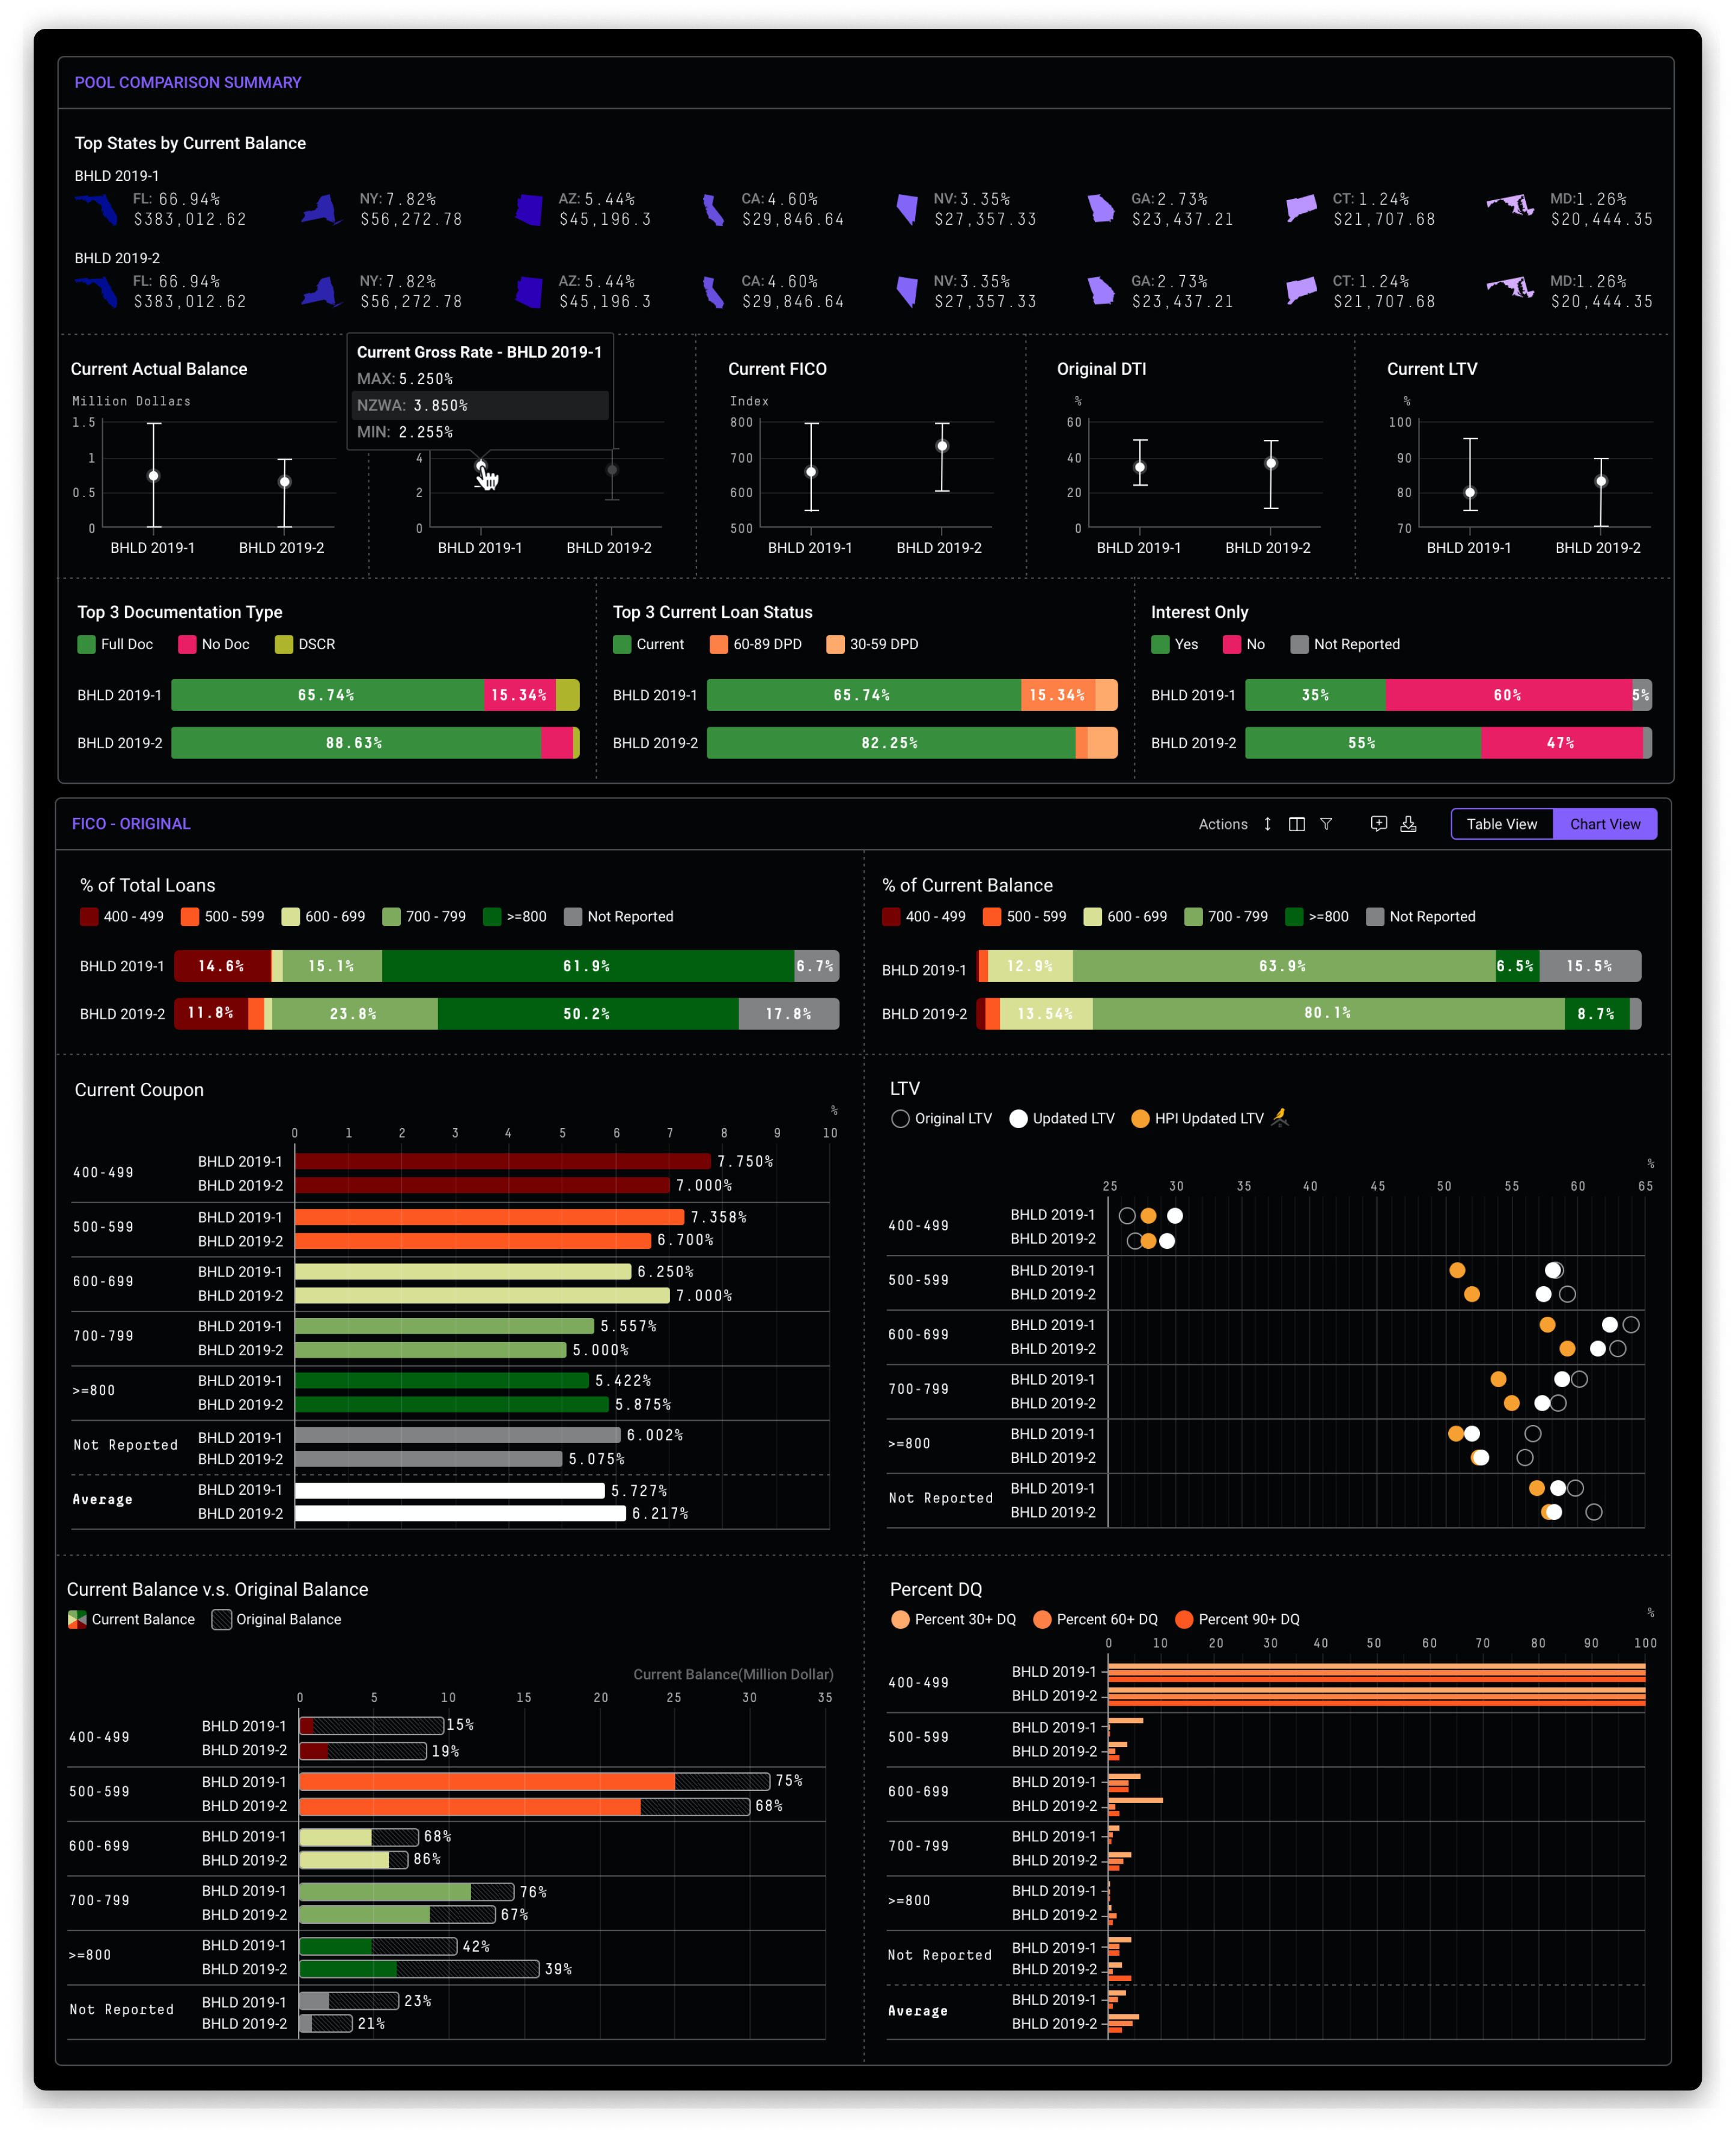
Turning dense, multi-dimensional financial data into experiences that feel intuitive — that is the core challenge and the reward of this work.
Loan-Level Detail
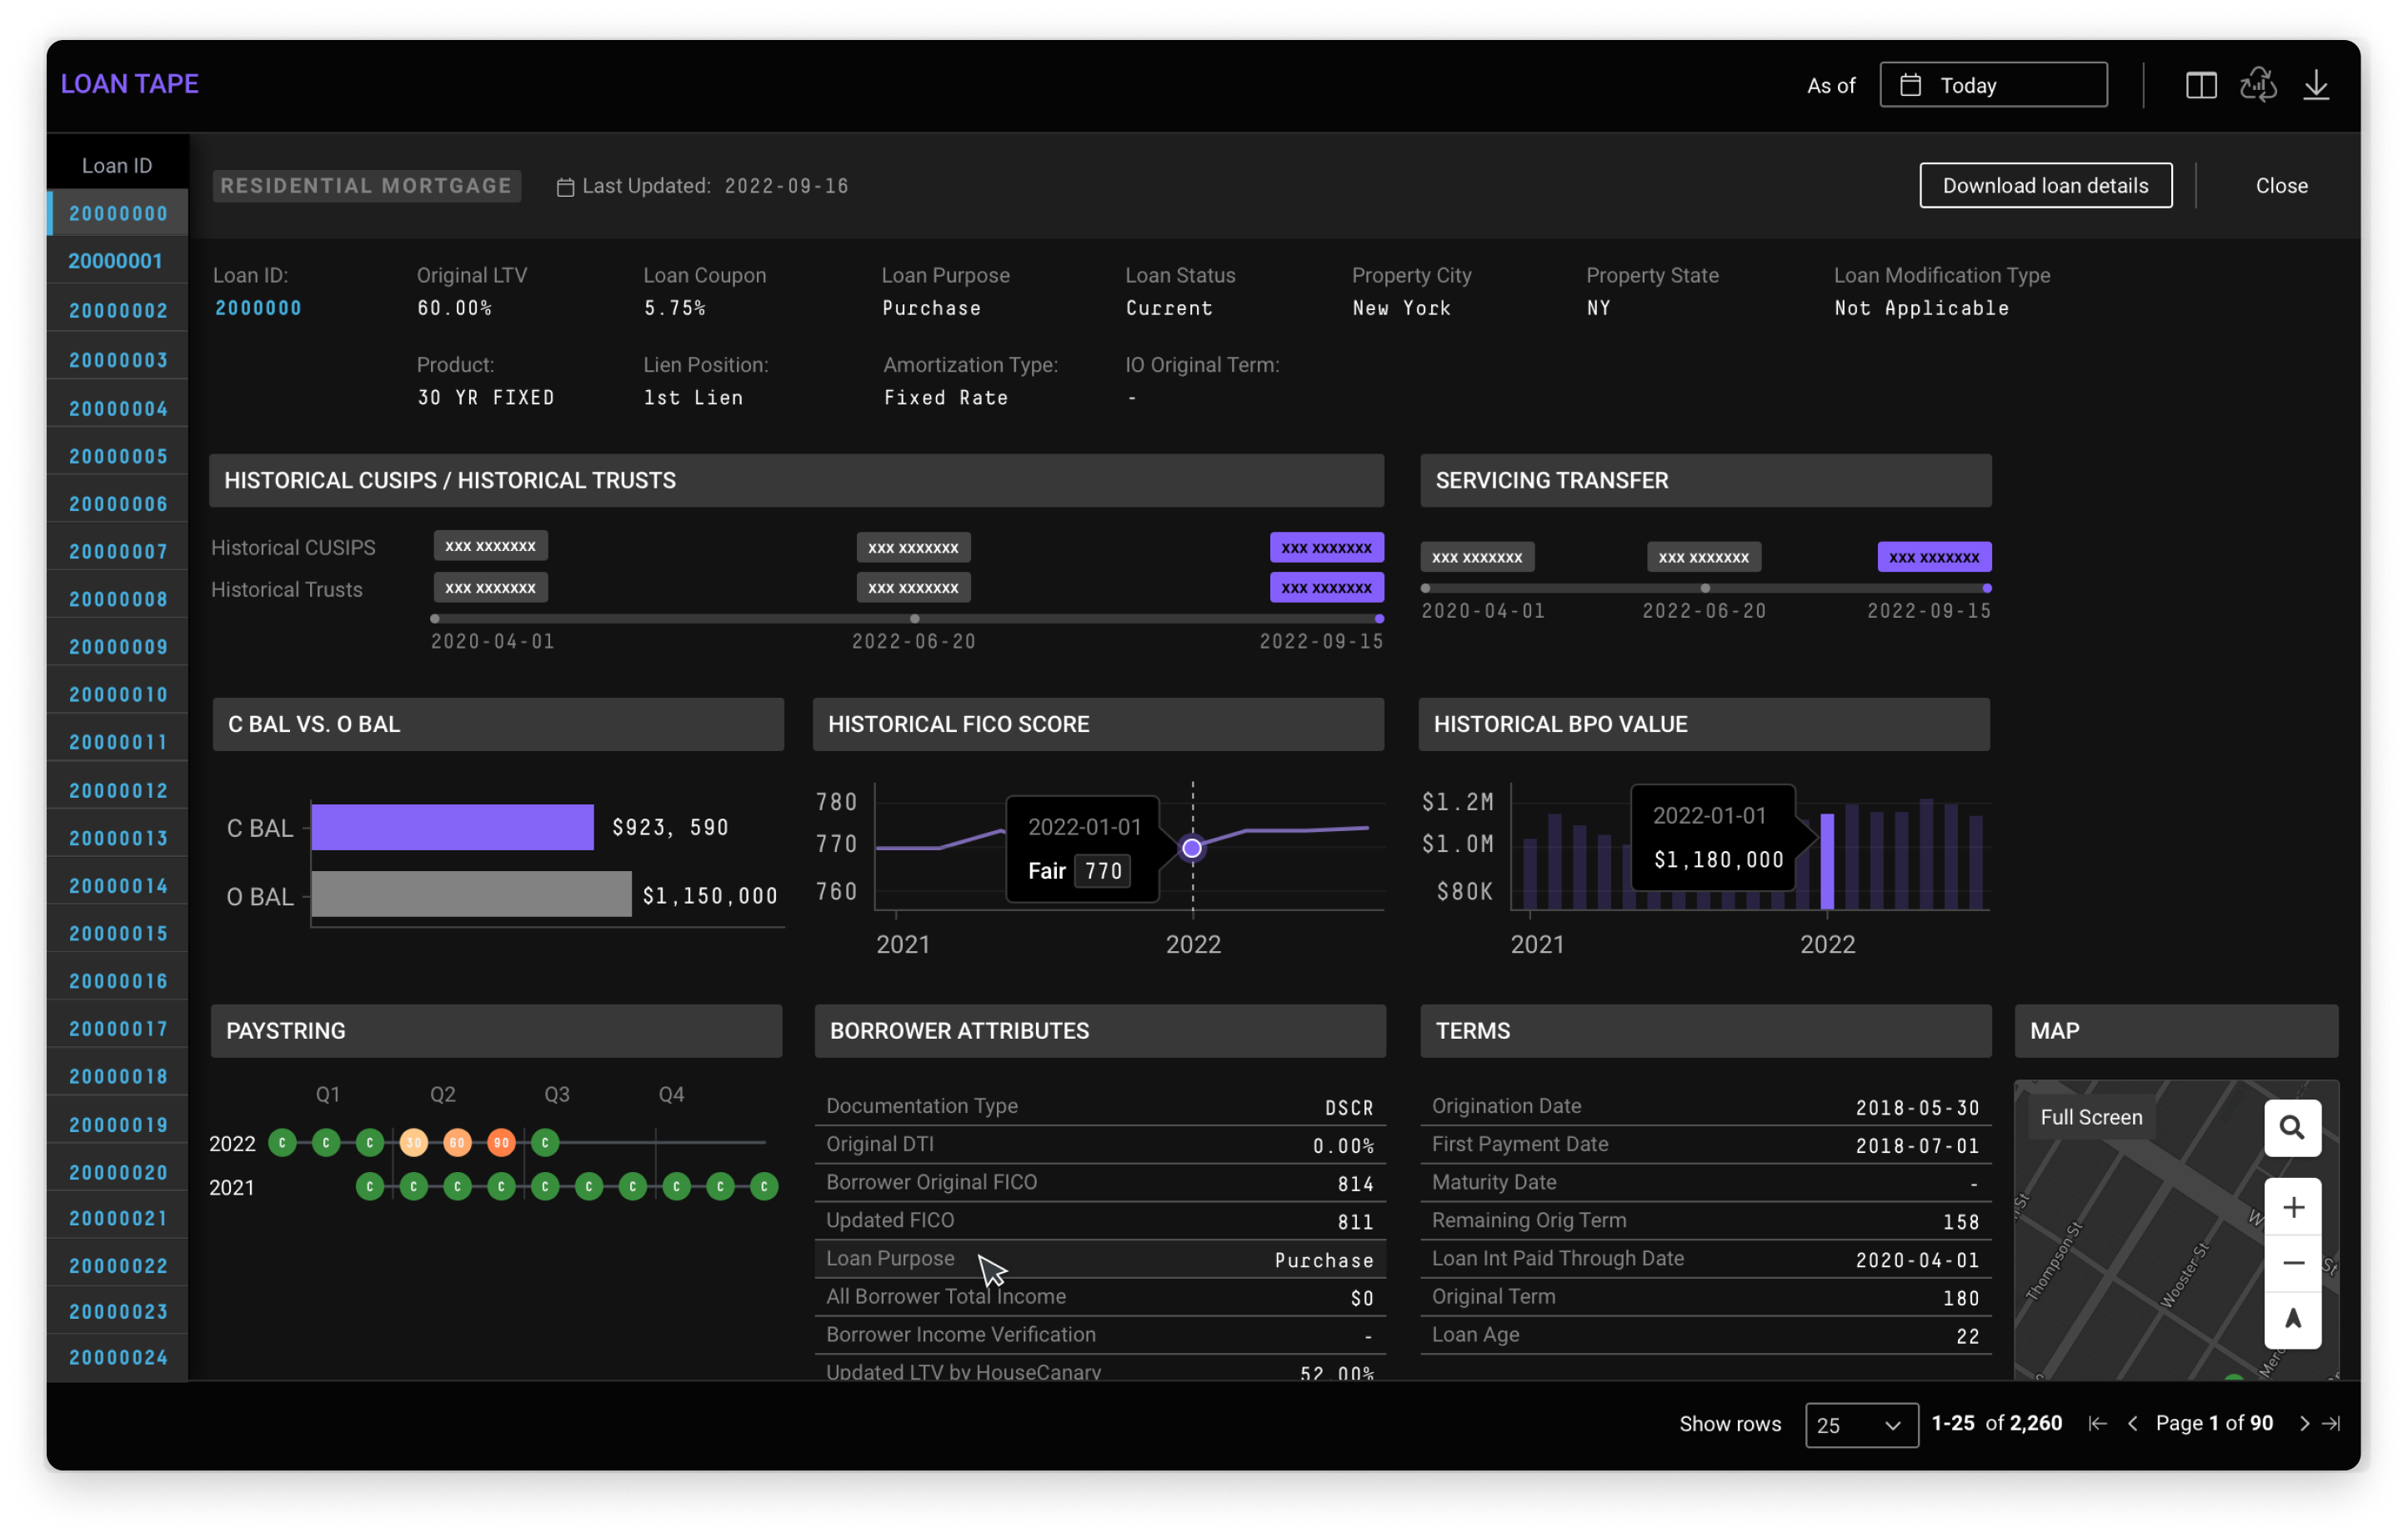
Designed the loan tape experience — a deep-dive view into individual loan attributes including historical FICO scores, balance history, paystring, and borrower attributes. The interface balances information density with readability, enabling analysts to investigate specific loans within the broader portfolio context.
Design System
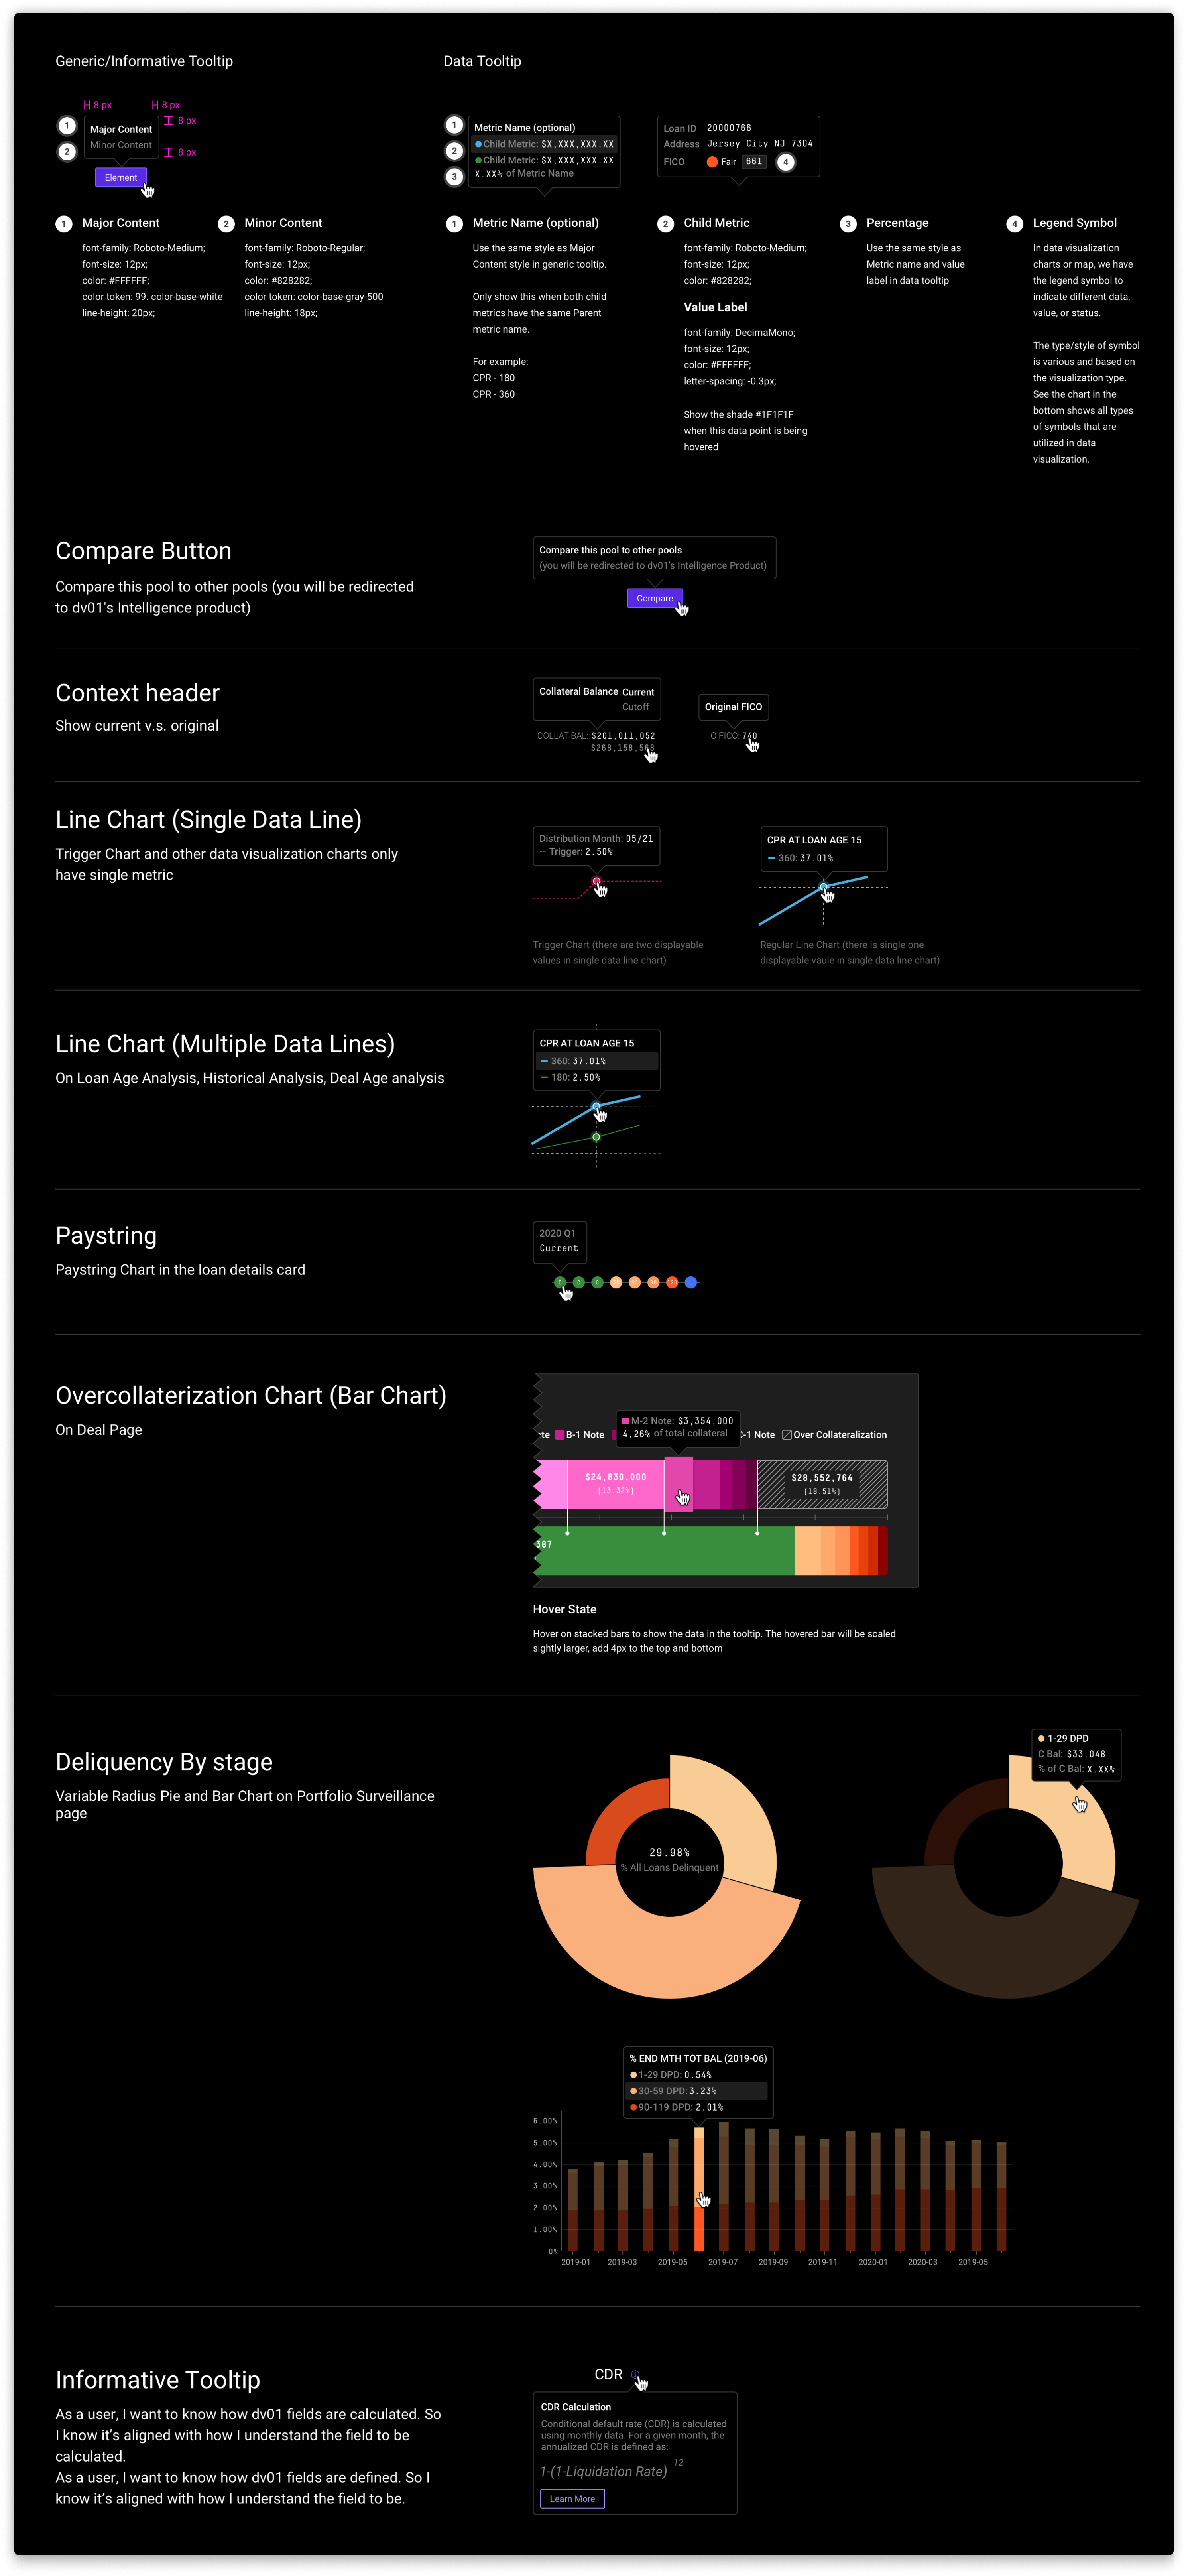
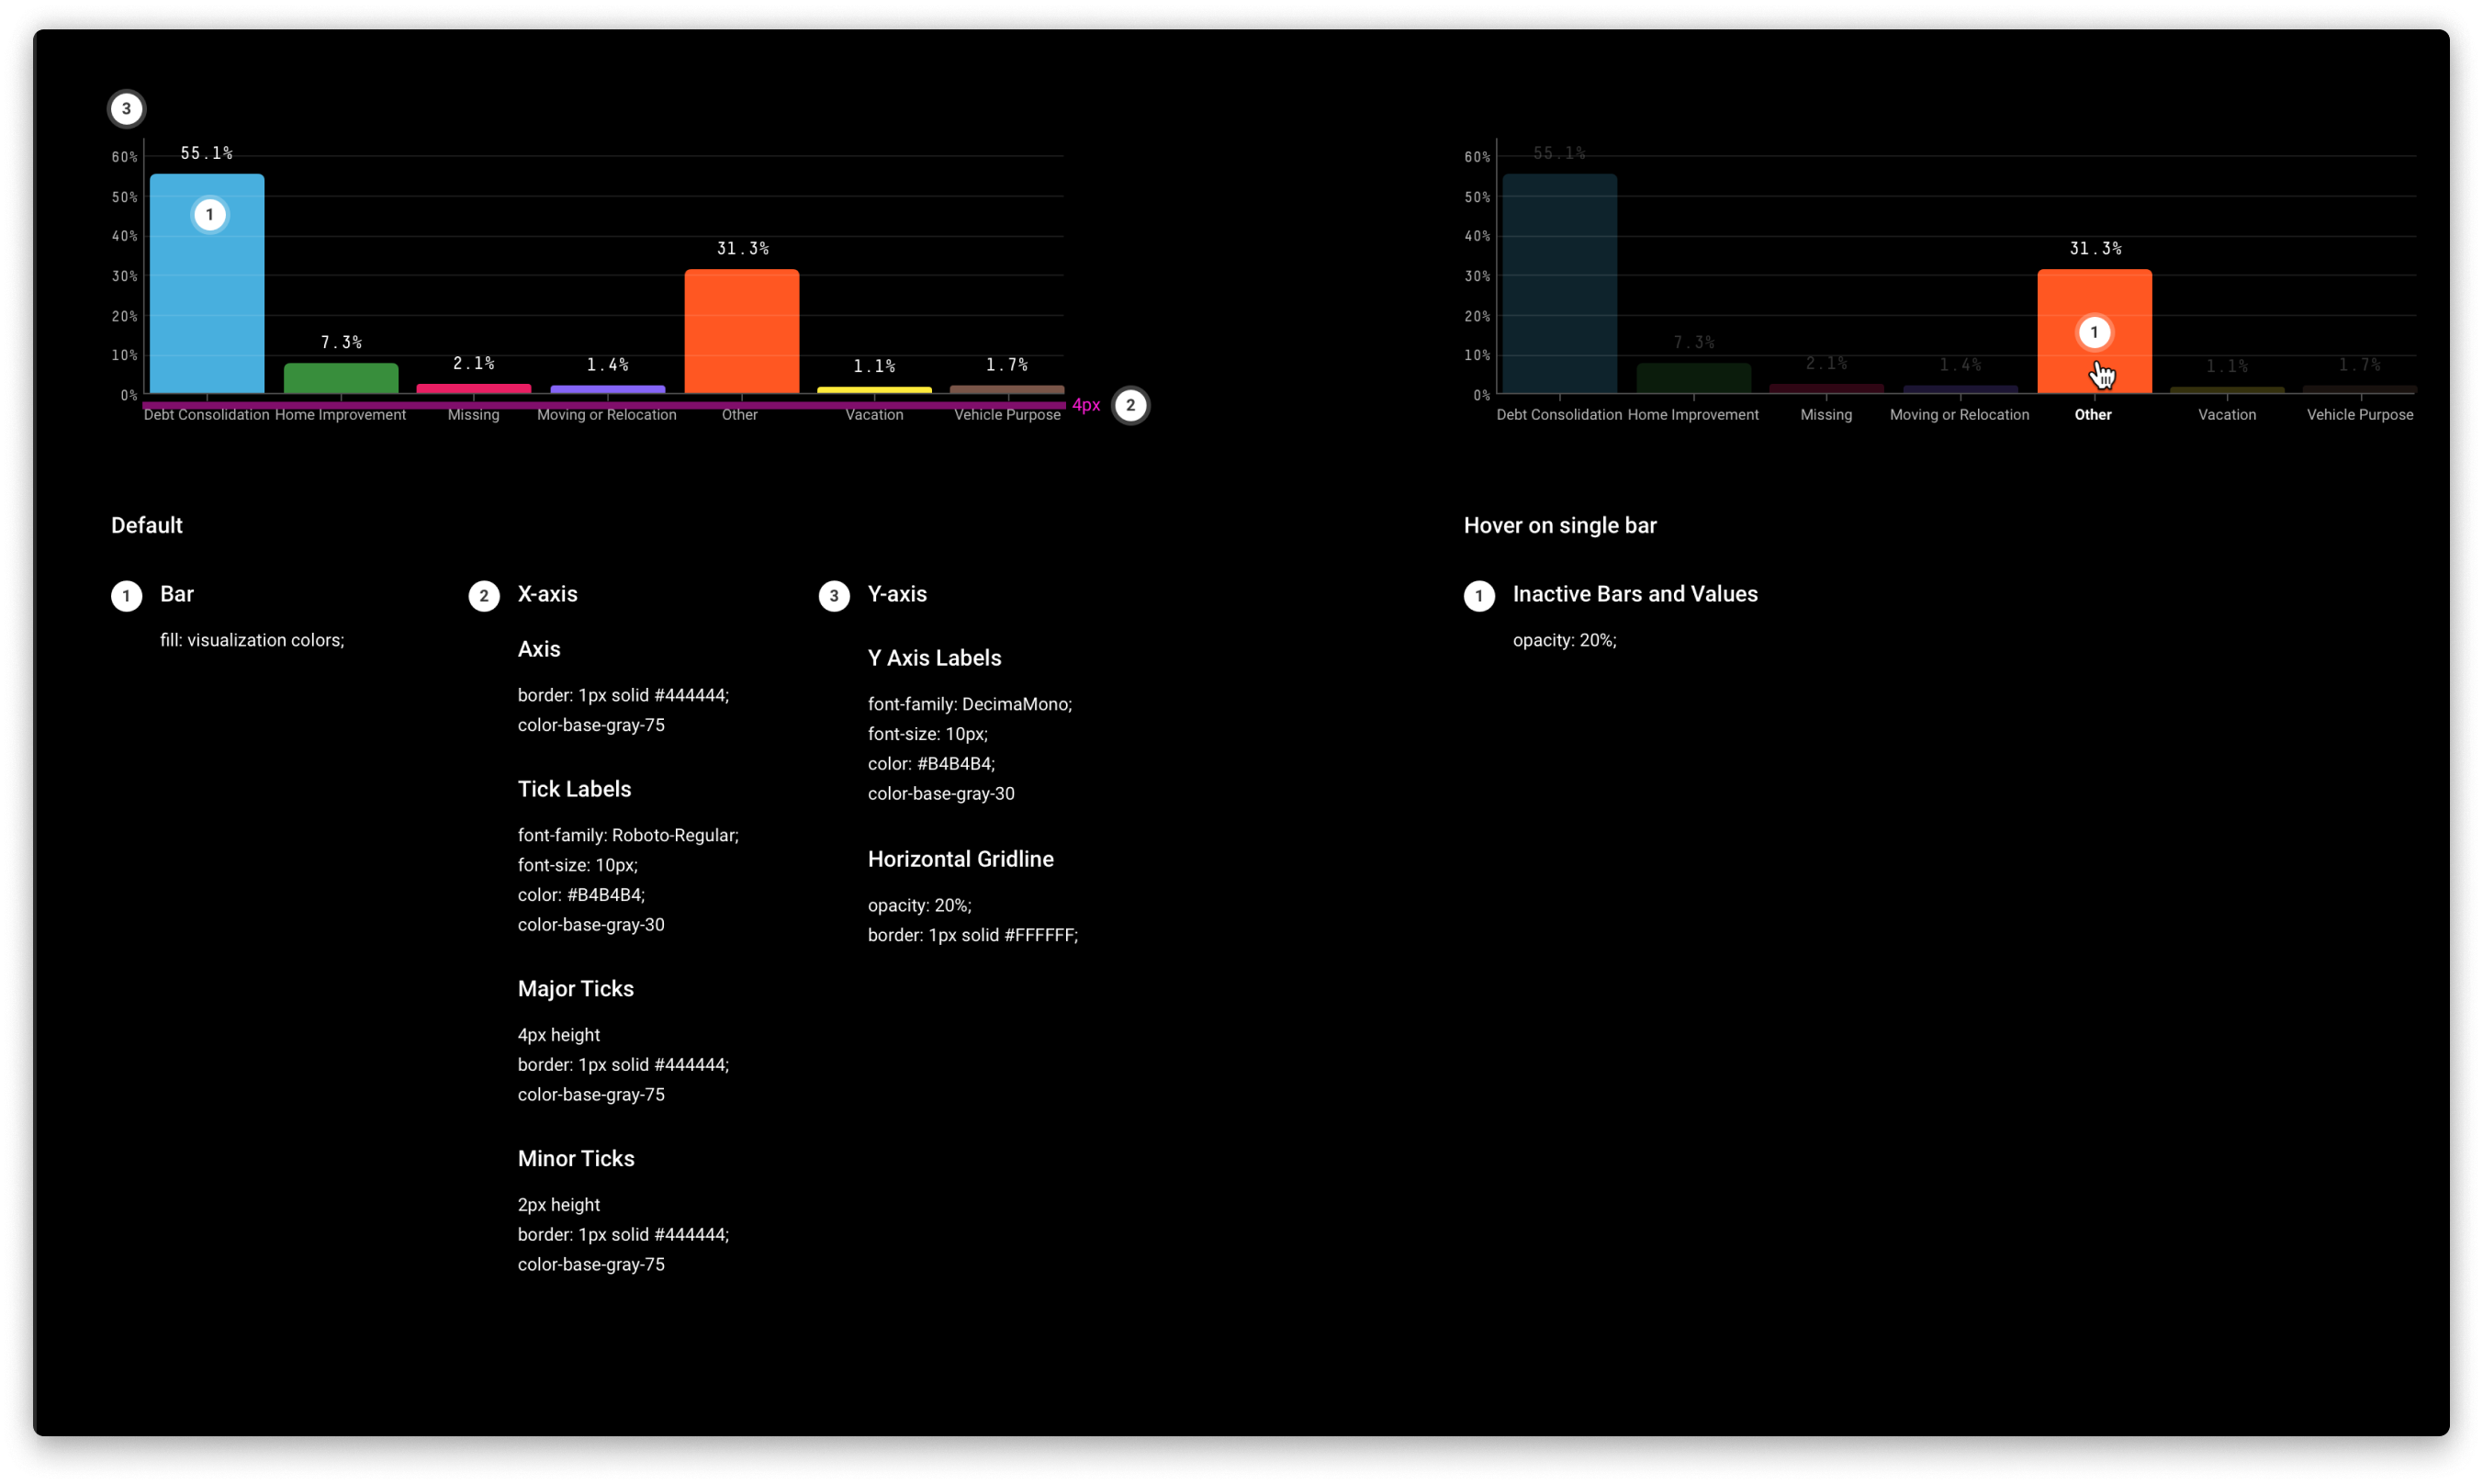
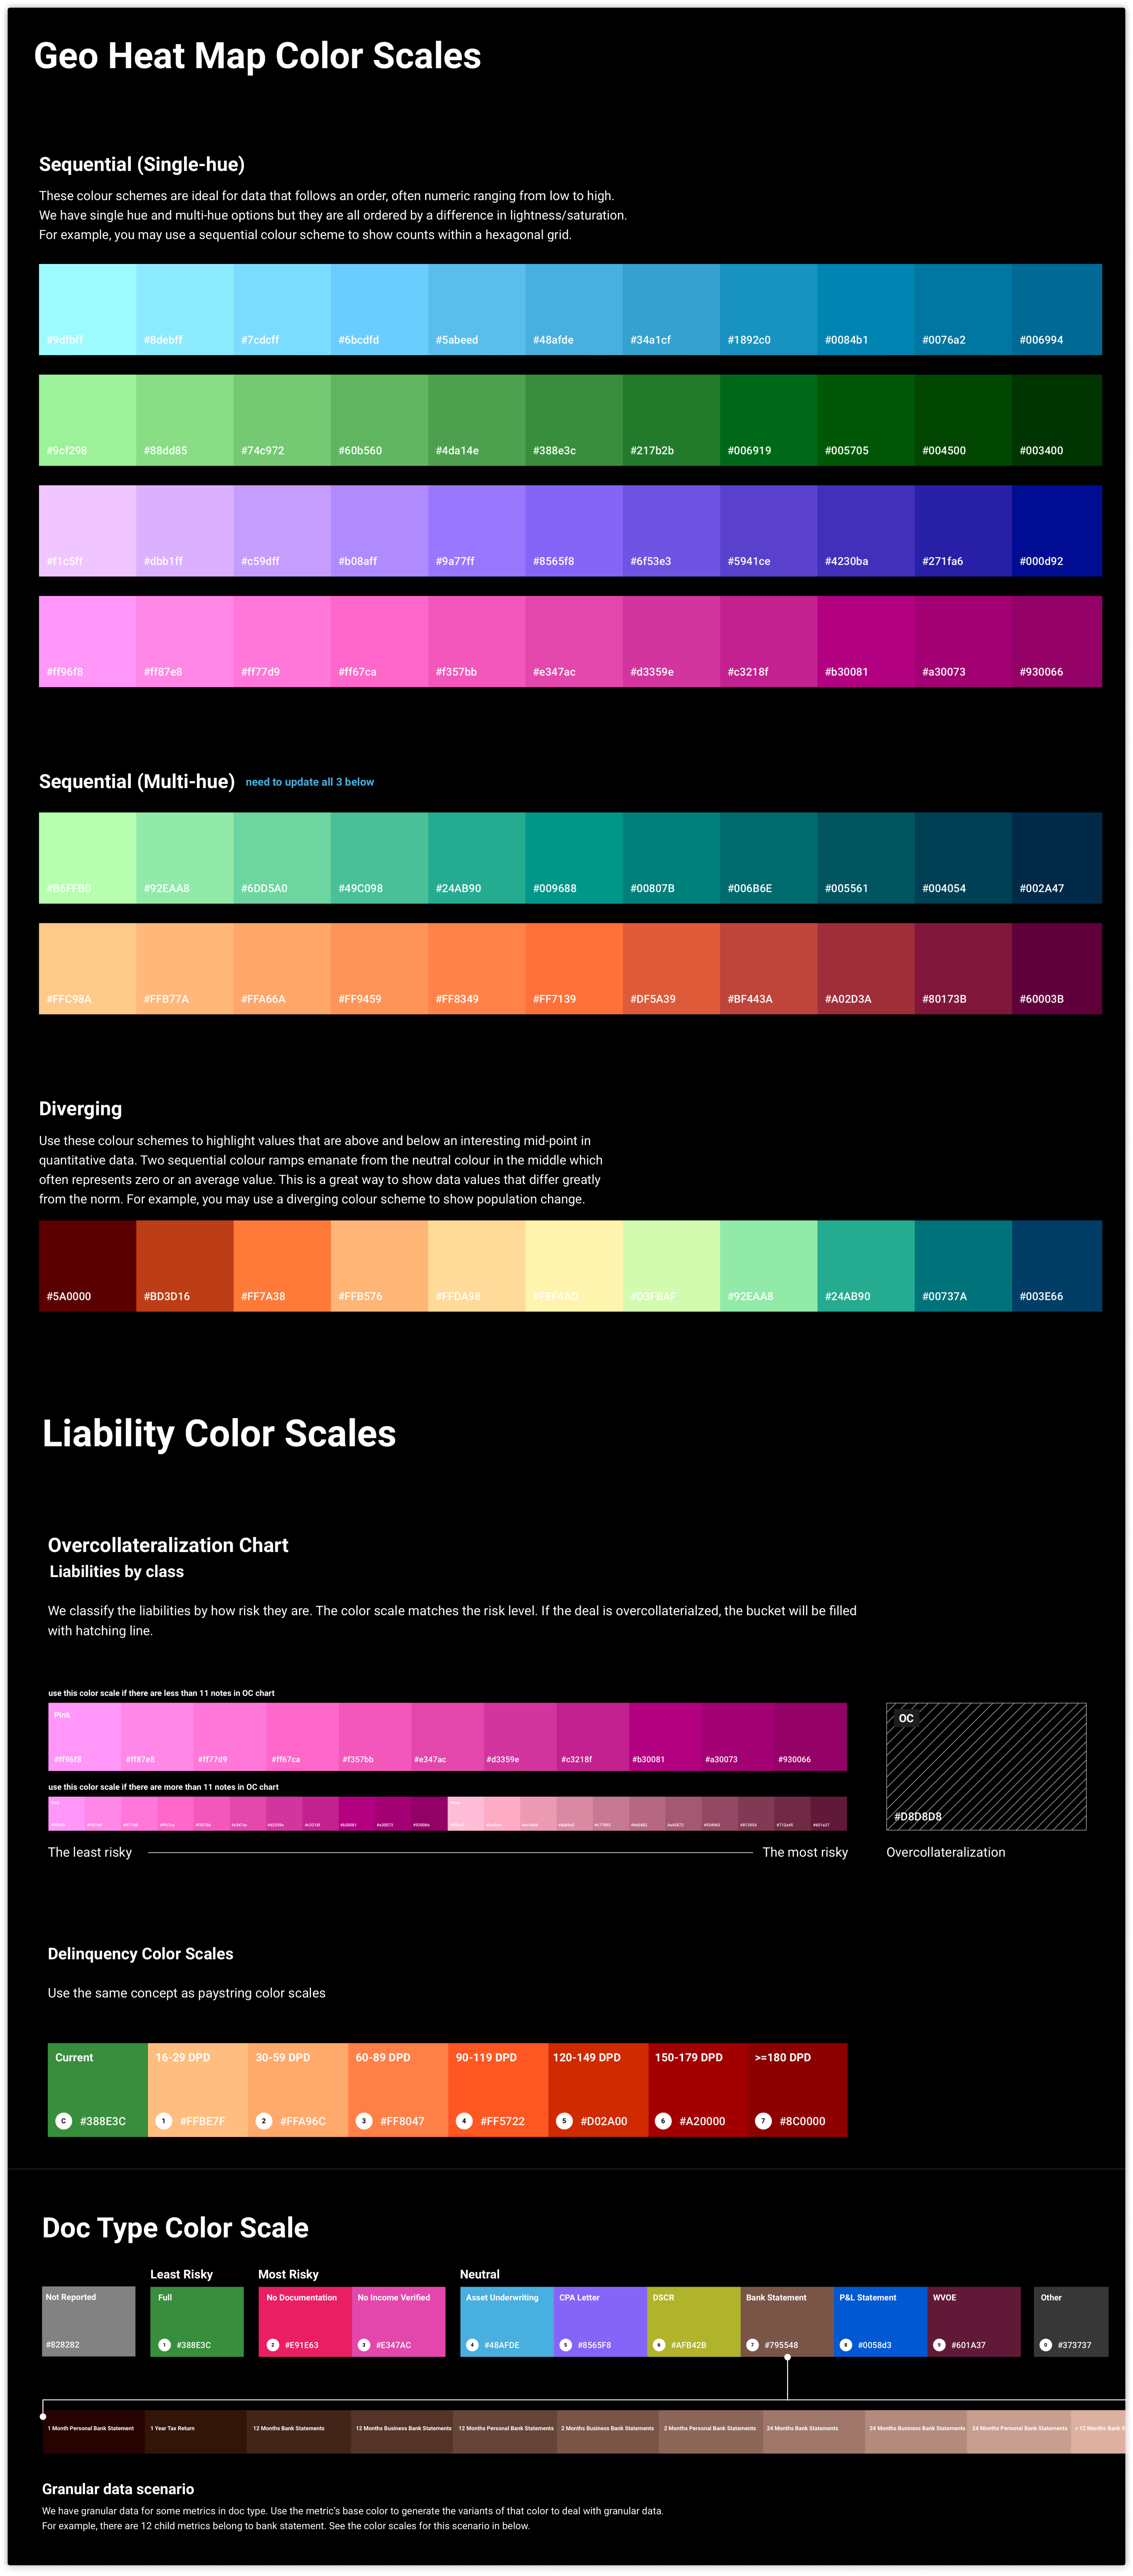
Co-authored and maintained the dv01 design system — a comprehensive component library covering data tables, chart primitives, filter controls, and layout scaffolding. The system ensured visual consistency across a product with hundreds of screens while significantly accelerating the velocity of feature delivery.
Next →
ESX — Sports Prediction Market Platform